Concept explainers
Using excel, plot the graph shows the deflection of a beam and also calculate the maximum deflection of the beam.
Answer to Problem 12P
Using excel, a table and graph is created to shows the deflection of a beam and the maximum deflection of the beam is
Explanation of Solution
Given data:
The length of the cantilever beam is
The modulus of elasticity
That is,
The second moment of area
That is,
The distributed load
Formula used:
Formula to calculate the deflection of the cantilever of the beam is,
Here,
Calculation:
Consider the distance (x) from the support as shown with the range from
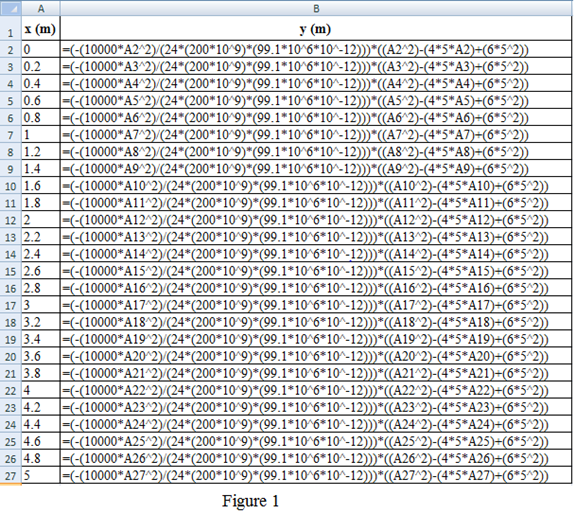
Refer to the Figure 1:
Column A shows the distance
Column B shows the deflection
Here, A2 cell represent the distance
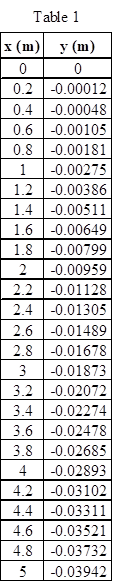
Table 1 shows the distance
Refer to the Figure 14.16 in the textbook.
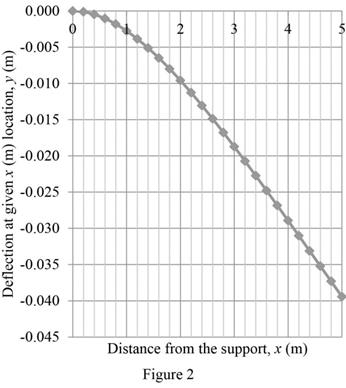
Draw the graph for the distance
For X-axis, scale change is done by clicking the Layout on toolbar and picks the “Axes”. Choose the primary horizontal axis and select the “More Primary Horizontal Axis Options”. A dialog box of Format axis shows the axis option in that click the fixed and type the minimum value as 0, maximum value as 5, and major unit as 1 and minor unit as 0.2 and click the close option.
Likewise for Y-axis, scale change is done by clicking the Layout on toolbar and picks the “Axes”. Choose the primary vertical axis and select the “More Primary Vertical Axis Options”. A dialog box of Format axis shows the axis option in that click the fixed and type the minimum value as
Figure 2 shows the curve of the deflection of a cantilever beam.
For the maximum deflection of the beam, the distance
That is,
Given,
Substitute the unit
Substitute
Thus, the maximum deflection of the beam is
Conclusion:
Hence, a table and graph is created using excel to shows the deflection of a beam and the maximum deflection of the beam is
Want to see more full solutions like this?
Chapter 14 Solutions
EBK ENGINEERING FUNDAMENTALS: AN INTROD


- A sample of Achilles saturated with water has a mass of 1710 g. After heating in an oven, a constant mass of 1815 g is obtained. The density of solid Achilles seeds is 2.78 g/cm3. We are asked to calculate: a) The water content and void ratio b) The porosity and specific gravity of the clayey soil c) The wet density of the clayey soil, the corresponding dry density and dry densityarrow_forward8. A prestressed concrete beam is subjected to the following stress distributions: Pi is the initial prestressing force, Pe is the effective prestressing force, M, is the bending moment due to self- weight, Ma and M, are the dead load and live load bending moment, respectively. The concrete has the following properties: fr = 6000 psi and fri = 4200 psi +250 -85 -2500 +550 Pe+ Mo+Ma+Mi P alone P₁+ Mo -2450 -3500 Stress at midspan +210 +250 P, alone Pe alone -2500 -3500 Stress at ends Using Table 22.1, evaluate whether the stresses at the center of the span and the end of the span comply with the permissible stress limits. The beam is classified as U-class. Provide justifications for each condition listed in the table. Note: Calculated stresses are to be taken from the above diagram, and permissible stresses are to be calculated using Table 22.1. Compressive stresses immediately after transfer Tensile stresses immediately after transfer Compressive stresses under sustained and total…arrow_forward10. A short column is subjected to an eccentric loading. The axial load P = 1000 kips and the eccentricity e = 12 in. The material strengths are fy = 60 ksi and f = 6000 psi. The Young's modulus of steel is 29000 ksi. (a) Fill in the blanks in the interaction diagram shown below. (2pts each, 10pt total) Po Pn (1) failure range H 3" 30" Ast 6 No. 10 bars = P 22" I e H 3" (4) e = e small Load path for given e Radial lines show constant (2) eb (3) e large failure range Mn (5) e= Mo (b) Compute the balanced failure point, i.e., P and Mb.arrow_forward
- No chatgpt plsarrow_forward11. The prestressed T beam shown below is pretensioned using low relaxation stress-relieved Grade 270 strands. The steel area Aps = 2.5 in². The tensile strength is fpu = 270 ksi, and the concrete compressive strength is fr = 6000 psi. (a) Calculate the nominal moment strength Mn with hr = 6 in. 22" 15" T hf (b) Since this beam is a T-beam, the nominal moment strength M₁ increases with a thicker hf. However, M, stops increasing if he reaches a value. Determine the minimum thickness hy that can achieve the maximum nominal moment strength Mr. Also, calculate the corresponding maximum nominal moment strength Mn with the computed hf.arrow_forward10. A short column is subjected to an eccentric loading. The axial load P = 1000 kips and the eccentricity e = 12 in. The material strengths are fy = 60 ksi and f = 6000 psi. The Young's modulus of steel is 29000 ksi. (a) Fill in the blanks in the interaction diagram shown below. 30" Ast 6 No. 10 bars = Pn (1) Po (4) e = e small Load path for given e failure range Radial lines show constant (2) eb (3) e large failure range Mn (5) e= Mo (b) Compute the balanced failure point, i.e., P and Mb. H 3" P 22" I e H 3"arrow_forward
- 10. A short column is subjected to an eccentric loading. The axial load P = 1000 kips and the eccentricity e = 12 in. The material strengths are fy = 60 ksi and f = 6000 psi. The Young's modulus of steel is 29000 ksi. (a) Fill in the blanks in the interaction diagram shown below. 30" Ast 6 No. 10 bars = Pn (1) Po (4) e = e small Load path for given e failure range Radial lines show constant (2) eb (3) e large failure range Mn (5) e= Mo (b) Compute the balanced failure point, i.e., P and Mb. H 3" P 22" I e H 3"arrow_forward7. Match the given strand profiles with the corresponding loading conditions for a prestressed concrete (PSC) beam. Strand profile (b) (d) (c) (a) Ꮎ Load on a beamarrow_forward4. For serviceability considerations, the effective moment of inertia (Ie) is calculated using the following formula: le 1 - 1cr ((2/3) Mcr) Ma 2 - وا ≥ Note that the upper bound was previously set as Iut in the earlier ACI equation. (a) Arrange the following moment of inertia values in ascending order (from smallest to largest): le, Ier, Ig and lut (b) Mer is the cracking moment. Choose the cross-section that should be used to compute Mcr. NA. h 5. Identify and circle the figure that represents the scenario in which the torsional effect is permitted to be reduced according to the ACI code provisions. (3 pts) mt mi B (b)arrow_forward
- I will rate, thanksarrow_forward. 9. A reinforced concrete beam is subjected to V/ = 40 kips and Tu/ = 12 ft kips at the critical section. Given conditions: ⚫ Longitudinal reinforcements use No. 8 grade 60 steel with an effective depth d = 20 in. For shear capacity, V = 18 kips and V₂ = 22 kips • For transverse reinforcements, use No. 3 bars with grade 60. • The effective torsional area of A. = 150 in². • Crack angle = 45° ⚫ The minimum stirrup spacing is Smin = 4" and the maximum stirrup spacing is Smax = Find the required stirrup spacing at the critical section. 8".arrow_forward3. The beam shown on the right uses three No. 8 bars made of Grade 60 steel as longitudinal reinforcement. The allowable maximum center-to-center spacing of the longitudinal rebars has been determined to be 10 inches. Now assume that Grade 80 steel will be used instead. Determine whether the beam satisfies the rebar spacing requirements according to the ACI Code. Additional assumptions: • Estimate fs = fy • 20" Clear cover: ? 12" Clear side cover: 1.5" The clear cover depth cc and the clear side cover remain unchanged, regardless of the change in material.arrow_forward
 Engineering Fundamentals: An Introduction to Engi...Civil EngineeringISBN:9781305084766Author:Saeed MoaveniPublisher:Cengage Learning
 Residential Construction Academy: House Wiring (M...Civil EngineeringISBN:9781285852225Author:Gregory W FletcherPublisher:Cengage Learning