Concept explainers
Videos
The following table shows the life expectancy by year of birth of females in the United States:
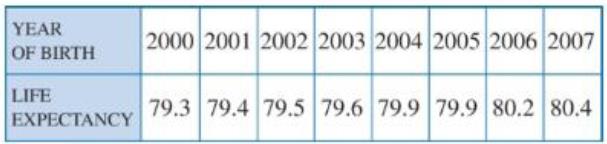
(a) Take
(b) Use a graphing utility to make a graph that shows the data points and the regression line.
(c) Use the regression line to make a conjecture about the life expectancy of females born in the year 2015.
Want to see the full answer?
Check out a sample textbook solution
Chapter 13 Solutions
EBK CALCULUS EARLY TRANSCENDENTALS SING
Additional Math Textbook Solutions
Precalculus: Concepts Through Functions, A Unit Circle Approach to Trigonometry (4th Edition)
University Calculus: Early Transcendentals (3rd Edition)
Precalculus (10th Edition)
Calculus, Single Variable: Early Transcendentals (3rd Edition)
Thomas' Calculus: Early Transcendentals (14th Edition)
Calculus: Early Transcendentals (3rd Edition)


- bThe average rate of change of the linear function f(x)=3x+5 between any two points is ________.arrow_forwardLife Expectancy The following table shows the average life expectancy, in years, of a child born in the given year42 Life expectancy 2005 77.6 2007 78.1 2009 78.5 2011 78.7 2013 78.8 a. Find the equation of the regression line, and explain the meaning of its slope. b. Plot the data points and the regression line. c. Explain in practical terms the meaning of the slope of the regression line. d. Based on the trend of the regression line, what do you predict as the life expectancy of a child born in 2019? e. Based on the trend of the regression line, what do you predict as the life expectancy of a child born in 1580?2300arrow_forwardXYZ Corporation Stock Prices The following table shows the average stock price, in dollars, of XYZ Corporation in the given month. Month Stock price January 2011 43.71 February 2011 44.22 March 2011 44.44 April 2011 45.17 May 2011 45.97 a. Find the equation of the regression line. Round the regression coefficients to three decimal places. b. Plot the data points and the regression line. c. Explain in practical terms the meaning of the slope of the regression line. d. Based on the trend of the regression line, what do you predict the stock price to be in January 2012? January 2013?arrow_forward
- Demand for Candy Bars In this problem you will determine a linear demand equation that describes the demand for candy bars in your class. Survey your classmates to determine what price they would be willing to pay for a candy bar. Your survey form might look like the sample to the left. a Make a table of the number of respondents who answered yes at each price level. b Make a scatter plot of your data. c Find and graph the regression line y=mp+b, which gives the number of respondents y who would buy a candy bar if the price were p cents. This is the demand equation. Why is the slope m negative? d What is the p-intercept of the demand equation? What does this intercept tell you about pricing candy bars? Would you buy a candy bar from the vending machine in the hallway if the price is as indicated. Price Yes or No 50 75 1.00 1.25 1.50 1.75 2.00arrow_forwardCan the average rate of change of a function be constant?arrow_forwardWhat is regression analysis? Describe the process of performing regression analysis on a graphing utility.arrow_forward
- A recent 10-year study conducted by a research team at the Great Falls Medical School was conducted to assess how age, systolic blood pressure, and smoking relate to the risk of strokes. Assume that the following data are from a portion of this study. Risk is interpreted as the probability (times 100) that the patient will have a stroke over the next 10-year period. For the smoking variable, define a dummy variable with 1 indicating a smoker and 0 indicating a nonsmoker. Risk 10 25 12 28 50 17 32 37 15 22 36 15 48 15 36 8 34 4 38 Age 58 65 58 86 59 76 56 78 80 78 71 70 67 77 60 82 66 80 62 59 Systolic Blood Pressure 152 163 155 177 196 189 155 120 135 98 152 173 135 209 199 119 166 125 117 209 Smoker Yes No No Yes Yes Yes Yes No No No No Yes Yes Yes No Yes No No No Yesarrow_forwardA study of the amount of rainfall and the quantity of air pollution removed produced the accompanying data. Complete parts (a) and (b) below. Click the icon to view the daily rainfall and air pollution data. (a) Find the equation of the regression line to predict the particulate removed from the amourt of daily rainfall. The equation is y = + ( )x. (Round to two decimal places as needed.) Daily Rainfall and Air Pollution Data Daily Rainfall, Particulate Removed, y x (0.01 cm) (μg/m³) 4.3 127 4.5 120 5.9 116 5.6 118 6.1 113 5.2 117 3.7 131 2.1 142 7.4 108 Print Done ☑arrow_forwardThe table shows the average weekly wages (in dollars) for state government employees and federal government employees for 8 years. The equation of the regression line is y 1.405x-12.668. Complete parts (a) and (b) below. Average Weekly Wages (state), x 758 767 785 820 Average Weekly Wages (federal), y 835 889 927 948 1008 1045 1120 1150 1202 1255 1278 1292 (a) Find the coefficienkof determination and interpret the result. (Round to three decimal places as needed.) Enter your answer in the answer box and then click Check Answer. Check Answer Clear All 3 parts remaining javascript:doExercise(25); 6f DI DIl 80 888 FS F3 F4 esc 9% & %23 %24 5 6 80 2 3 Y. U E RI K H. w/arrow_forward
 Functions and Change: A Modeling Approach to Coll...AlgebraISBN:9781337111348Author:Bruce Crauder, Benny Evans, Alan NoellPublisher:Cengage Learning

 Algebra and Trigonometry (MindTap Course List)AlgebraISBN:9781305071742Author:James Stewart, Lothar Redlin, Saleem WatsonPublisher:Cengage Learning
 Glencoe Algebra 1, Student Edition, 9780079039897...AlgebraISBN:9780079039897Author:CarterPublisher:McGraw Hill
 College AlgebraAlgebraISBN:9781305115545Author:James Stewart, Lothar Redlin, Saleem WatsonPublisher:Cengage Learning