
Mathematical Statistics with Applications
7th Edition
ISBN: 9781111798789
Author: Dennis O. Wackerly
Publisher: Cengage Learning
expand_more
expand_more
format_list_bulleted
Videos
Textbook Question
Chapter 13.7, Problem 23E
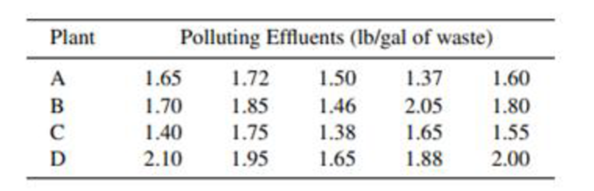
Refer to Exercise 13.7.
- a Construct a 95% confidence interval for the
mean amount of polluting effluent per gallon for plant A. If the limit for the mean amount of polluting effluent is 1.5 pound/gallon, would you conclude that plant A exceeds this limit? Why? - b Give a 95% confidence interval for the difference in mean polluting effluent per gallon for plants A and D. Does this interval indicate that mean effluent per gallon differs for these two plants? Why?
13.7 Four chemical plants, producing the same products and owned by the same company, discharge effluents into streams in the vicinity of their locations. To monitor the extent of pollution created by the effluents and to determine whether this differs from plant to plant, the company collected random samples of liquid waste, five specimens from each plant. The data are given in the accompanying table.
- a Do the data provide sufficient evidence to indicate a difference in the mean weight of effluents per gallon in the effluents discharged from the four plants? Test using α = .05.
- b Applet Exercise Find the p-value associated with the test in part (a) using the applet F-Ratio Probabilities and Quantiles.
Expert Solution & Answer
Want to see the full answer?
Check out a sample textbook solution
Students have asked these similar questions
Task Description:
Read the following case study and answer the questions that follow.
Ella is a 9-year-old third-grade student in an inclusive classroom. She has been diagnosed with Emotional and Behavioural Disorder (EBD). She has been struggling academically and socially due to
challenges related to self-regulation, impulsivity, and emotional outbursts. Ella's behaviour includes frequent tantrums, defiance toward authority figures, and difficulty forming positive relationships with peers. Despite her challenges, Ella shows an interest in art and creative activities and demonstrates strong verbal skills when calm.
Describe 2 strategies that could be implemented that could help Ella regulate her emotions in class (4 marks)
Explain 2 strategies that could improve Ella’s social skills (4 marks)
Identify 2 accommodations that could be implemented to support Ella academic progress and provide a rationale for your recommendation.(6 marks)
Provide a detailed explanation of 2 ways…
Question 2: When John started his first job, his first end-of-year salary was $82,500. In the following years, he received salary raises as shown in the following table.
Fill the Table: Fill the following table showing his end-of-year salary for each year. I have already provided the end-of-year salaries for the first three years. Calculate the end-of-year salaries for the remaining years using Excel. (If you Excel answer for the top 3 cells is not the same as the one in the following table, your formula / approach is incorrect) (2 points)
Geometric Mean of Salary Raises: Calculate the geometric mean of the salary raises using the percentage figures provided in the second column named “% Raise”. (The geometric mean for this calculation should be nearly identical to the arithmetic mean. If your answer deviates significantly from the mean, it's likely incorrect. 2 points)
Starting salary
% Raise
Raise
Salary after raise
75000
10%
7500
82500
82500
4%
3300…
I need help with this problem and an explanation of the solution for the image described below. (Statistics: Engineering Probabilities)
Chapter 13 Solutions
Mathematical Statistics with Applications
Ch. 13.2 - The reaction times for two different stimuli in a...Ch. 13.2 - Prob. 2ECh. 13.4 - State the assumptions underlying the ANOVA of a...Ch. 13.4 - Prob. 4ECh. 13.4 - Prob. 5ECh. 13.4 - Suppose that independent samples of sizes n1, n2,,...Ch. 13.4 - Four chemical plants, producing the same products...Ch. 13.4 - Prob. 8ECh. 13.4 - Prob. 9ECh. 13.4 - A clinical psychologist wished to compare three...
Ch. 13.4 - It is believed that women in the postmenopausal...Ch. 13.4 - If vegetables intended for human consumption...Ch. 13.4 - One portion of the research described in a paper...Ch. 13.4 - The Florida Game and Fish Commission desires to...Ch. 13.4 - Prob. 15ECh. 13.4 - An experiment was conducted to examine the effect...Ch. 13.5 - Prob. 17ECh. 13.5 - Refer to Exercise 13.17 and consider YiYi for i ...Ch. 13.5 - Refer to the statistical model for the one-way...Ch. 13.7 - Refer to Examples 13.2 and 13.3. a Use the portion...Ch. 13.7 - Refer to Examples 13.2 and 13.4. a Use the portion...Ch. 13.7 - a Based on your answers to Exercises 13.20 and...Ch. 13.7 - Refer to Exercise 13.7. a Construct a 95%...Ch. 13.7 - Prob. 24ECh. 13.7 - Prob. 25ECh. 13.7 - Prob. 26ECh. 13.7 - Prob. 27ECh. 13.7 - Prob. 28ECh. 13.7 - Prob. 29ECh. 13.7 - Prob. 30ECh. 13.7 - Prob. 31ECh. 13.7 - Prob. 32ECh. 13.7 - Prob. 33ECh. 13.7 - Prob. 34ECh. 13.7 - Prob. 35ECh. 13.8 - Prob. 36ECh. 13.8 - Prob. 37ECh. 13.8 - Prob. 38ECh. 13.8 - Prob. 39ECh. 13.8 - Prob. 40ECh. 13.9 - Prob. 41ECh. 13.9 - The accompanying table presents data on yields...Ch. 13.9 - Refer to Exercise 13.42. Why was a randomized...Ch. 13.9 - Prob. 44ECh. 13.9 - Prob. 45ECh. 13.9 - Prob. 46ECh. 13.9 - Prob. 47ECh. 13.9 - Prob. 48ECh. 13.9 - Prob. 49ECh. 13.9 - Prob. 50ECh. 13.9 - Prob. 51ECh. 13.10 - Prob. 52ECh. 13.10 - Prob. 53ECh. 13.10 - Prob. 54ECh. 13.10 - Refer to Exercise 13.46. Construct a 95%...Ch. 13.10 - Prob. 56ECh. 13.10 - Prob. 57ECh. 13.11 - Prob. 58ECh. 13.11 - Prob. 59ECh. 13.11 - Prob. 60ECh. 13.11 - Prob. 61ECh. 13.11 - Prob. 62ECh. 13.12 - Prob. 63ECh. 13.12 - Prob. 64ECh. 13.12 - Prob. 65ECh. 13.12 - Prob. 66ECh. 13.12 - Prob. 67ECh. 13.12 - Prob. 68ECh. 13.13 - Prob. 69ECh. 13.13 - Prob. 70ECh. 13.13 - Refer to Exercise 13.42. Answer part (a) by...Ch. 13.13 - Refer to Exercise 13.45. Answer part (b) by...Ch. 13 - Prob. 73SECh. 13 - Prob. 74SECh. 13 - Prob. 75SECh. 13 - Prob. 77SECh. 13 - A study was initiated to investigate the effect of...Ch. 13 - Prob. 79SECh. 13 - A dealer has in stock three cars (models A, B, and...Ch. 13 - In the hope of attracting more riders, a city...Ch. 13 - Prob. 84SECh. 13 - Prob. 85SECh. 13 - Prob. 86SECh. 13 - Prob. 87SECh. 13 - Prob. 88SECh. 13 - Prob. 89SECh. 13 - Prob. 90SECh. 13 - Prob. 92SECh. 13 - Prob. 94SE
Knowledge Booster


Learn more about
Need a deep-dive on the concept behind this application? Look no further. Learn more about this topic, statistics and related others by exploring similar questions and additional content below.Similar questions
- I need help with this problem and an explanation of the solution for the image described below. (Statistics: Engineering Probabilities)arrow_forward310015 K Question 9, 5.2.28-T Part 1 of 4 HW Score: 85.96%, 49 of 57 points Points: 1 Save of 6 Based on a poll, among adults who regret getting tattoos, 28% say that they were too young when they got their tattoos. Assume that six adults who regret getting tattoos are randomly selected, and find the indicated probability. Complete parts (a) through (d) below. a. Find the probability that none of the selected adults say that they were too young to get tattoos. 0.0520 (Round to four decimal places as needed.) Clear all Final check Feb 7 12:47 US Oarrow_forwardhow could the bar graph have been organized differently to make it easier to compare opinion changes within political partiesarrow_forward
- 30. An individual who has automobile insurance from a certain company is randomly selected. Let Y be the num- ber of moving violations for which the individual was cited during the last 3 years. The pmf of Y isy | 1 2 4 8 16p(y) | .05 .10 .35 .40 .10 a.Compute E(Y).b. Suppose an individual with Y violations incurs a surcharge of $100Y^2. Calculate the expected amount of the surcharge.arrow_forward24. An insurance company offers its policyholders a num- ber of different premium payment options. For a ran- domly selected policyholder, let X = the number of months between successive payments. The cdf of X is as follows: F(x)=0.00 : x < 10.30 : 1≤x<30.40 : 3≤ x < 40.45 : 4≤ x <60.60 : 6≤ x < 121.00 : 12≤ x a. What is the pmf of X?b. Using just the cdf, compute P(3≤ X ≤6) and P(4≤ X).arrow_forward59. At a certain gas station, 40% of the customers use regular gas (A1), 35% use plus gas (A2), and 25% use premium (A3). Of those customers using regular gas, only 30% fill their tanks (event B). Of those customers using plus, 60% fill their tanks, whereas of those using premium, 50% fill their tanks.a. What is the probability that the next customer will request plus gas and fill the tank (A2 B)?b. What is the probability that the next customer fills the tank?c. If the next customer fills the tank, what is the probability that regular gas is requested? Plus? Premium?arrow_forward
- 38. Possible values of X, the number of components in a system submitted for repair that must be replaced, are 1, 2, 3, and 4 with corresponding probabilities .15, .35, .35, and .15, respectively. a. Calculate E(X) and then E(5 - X).b. Would the repair facility be better off charging a flat fee of $75 or else the amount $[150/(5 - X)]? [Note: It is not generally true that E(c/Y) = c/E(Y).]arrow_forward74. The proportions of blood phenotypes in the U.S. popula- tion are as follows:A B AB O .40 .11 .04 .45 Assuming that the phenotypes of two randomly selected individuals are independent of one another, what is the probability that both phenotypes are O? What is the probability that the phenotypes of two randomly selected individuals match?arrow_forward53. A certain shop repairs both audio and video compo- nents. Let A denote the event that the next component brought in for repair is an audio component, and let B be the event that the next component is a compact disc player (so the event B is contained in A). Suppose that P(A) = .6 and P(B) = .05. What is P(BA)?arrow_forward
arrow_back_ios
SEE MORE QUESTIONS
arrow_forward_ios
Recommended textbooks for you
 Big Ideas Math A Bridge To Success Algebra 1: Stu...AlgebraISBN:9781680331141Author:HOUGHTON MIFFLIN HARCOURTPublisher:Houghton Mifflin Harcourt
 Glencoe Algebra 1, Student Edition, 9780079039897...AlgebraISBN:9780079039897Author:CarterPublisher:McGraw Hill
Big Ideas Math A Bridge To Success Algebra 1: Stu...
Algebra
ISBN:9781680331141
Author:HOUGHTON MIFFLIN HARCOURT
Publisher:Houghton Mifflin Harcourt
Glencoe Algebra 1, Student Edition, 9780079039897...
Algebra
ISBN:9780079039897
Author:Carter
Publisher:McGraw Hill
Hypothesis Testing using Confidence Interval Approach; Author: BUM2413 Applied Statistics UMP;https://www.youtube.com/watch?v=Hq1l3e9pLyY;License: Standard YouTube License, CC-BY
Hypothesis Testing - Difference of Two Means - Student's -Distribution & Normal Distribution; Author: The Organic Chemistry Tutor;https://www.youtube.com/watch?v=UcZwyzwWU7o;License: Standard Youtube License