
EBK STATISTICS FOR BUSINESS AND ECONOMI
13th Edition
ISBN: 8220103633567
Author: Sincich
Publisher: PEARSON
expand_more
expand_more
format_list_bulleted
Concept explainers
Videos
Textbook Question
Chapter 13.5, Problem 13.29ACB
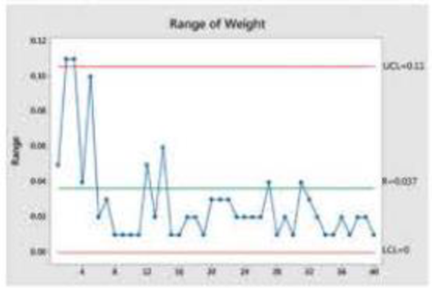
Weight of packed frozen scallops. In Quality Engineering (Vol. 28, No. 3, 2016), control charts were used to monitor the weight of frozen scallops packed at a marine products plant. During packing, the scallops are placed In plastic trays. The target total weight (scallops and plastic trays) is 2 kilograms. To monitor the packing process, the quality control department takes 5 samples of 5 plastic trays In the overnight shift every day and records the weight of each tray. An R-chart of weight for the first 40 samples is shown to the right.
- a. Identify the rational subgroups used to construct the R-chart.
- b. Is the process in control? If not, what do you recommend?
Expert Solution & Answer
Want to see the full answer?
Check out a sample textbook solution
Students have asked these similar questions
B
G
C
D
E
H
M
K
Armchair
For puzzles 96 and 97, use the first phylogenetic tree on the following page (Figure 2).
96) Who is the most recent common ancestor of species A and species G?
97) Who is the most recent common ancestor of species D, E, and F?
Not use ai please
Not use ai please
Chapter 13 Solutions
EBK STATISTICS FOR BUSINESS AND ECONOMI
Ch. 13.4 - What is a control chart? Describe its use.Ch. 13.4 - Explain why rational subgrouping should be used in...Ch. 13.4 - When a control chart is first constructed, why are...Ch. 13.4 - Which process parameter is an x -chart used to...Ch. 13.4 - Even if all the points on an x -chart fall between...Ch. 13.4 - What must be true about the variation of a process...Ch. 13.4 - Use the six pattern-analysis rules described in...Ch. 13.4 - Consider the x -chart shown below. a. Is the...Ch. 13.4 - Use Table IX on page 13-74 to find the value of A2...Ch. 13.4 - Twenty-five consecutive samples of size n = 5 were...
Ch. 13.4 - The data in the following table were collected for...Ch. 13.4 - Prob. 13.12ACBCh. 13.4 - Active pharmaceutical ingredient. During the...Ch. 13.4 - Detecting gender-related employment disparities....Ch. 13.4 - Pain levels of ICU patients. Various interventions...Ch. 13.4 - Quality control for irrigation data. Most farmers...Ch. 13.4 - Improving public health waiting times. Statistical...Ch. 13.4 - Cereal box manufacturing. A machine at K-Company...Ch. 13.4 - Detecting under-reported emissions. The...Ch. 13.4 - 13 20 Selecting the best wafer-slicing machine....Ch. 13.4 - Chunky data. BPI Consulting, a leading provider of...Ch. 13.4 - Military aircraft bolts. A precision parts...Ch. 13.5 - What characteristic of a process is an R-chart...Ch. 13.5 - Prob. 13.24LMCh. 13.5 - Use Table IX on page 13-74 to find the values of...Ch. 13.5 - Construct and interpret an R-chart for the data in...Ch. 13.5 - Construct and interpret an R-chart for the data in...Ch. 13.5 - Construct and interpret an R-chart and an x -chart...Ch. 13.5 - Weight of packed frozen scallops. In Quality...Ch. 13.5 - Detecting gender-related employment disparities....Ch. 13.5 - Pain levels of ICU patients. Refer to the Research...Ch. 13.5 - Quality control for irrigation data. Refer to...Ch. 13.5 - Lowering the thickness of an expensive blow-molded...Ch. 13.5 - Cola bottle filling process. A soft-drink bottling...Ch. 13.5 - Chunky data. Refer to Exercise 13.21e (p. 13-40)...Ch. 13.5 - Replacement times for lost ATM cards. In an effort...Ch. 13.5 - Military aircraft bolts. Refer to the...Ch. 13.5 - Precision of scale weight measurements. The...Ch. 13.6 - What characteristic of a process is a p-chart...Ch. 13.6 - In each of the following cases, use the sample...Ch. 13.6 - The proportion of defective items generated by a...Ch. 13.6 - To construct a p-chart for a manufacturing...Ch. 13.6 - To construct a p-chart, 20 samples of size 150...Ch. 13.6 - Academic failure rates in Nigeria. The quality...Ch. 13.6 - Monitoring surgery complications. An article on...Ch. 13.6 - Rental car call center study. A worldwide rental...Ch. 13.6 - Defective micron chips. A manufacturer produces...Ch. 13.6 - Hand break cable defects. In Control Engineering...Ch. 13.6 - Monitoring newspaper typesetters. Accurate...Ch. 13.6 - Quality of rewritable CDs. A Japanese compact disc...Ch. 13.6 - Leaky process pumps. Quality (February 2008)...Ch. 13.6 - Rubber company lire tests. Goodstone Tire Rubber...Ch. 13.7 - Explain why it is inappropriate to conduct a...Ch. 13.7 - Explain the difference between process spread and...Ch. 13.7 - Describe two different ways to assess the...Ch. 13.7 - Why is it recommended to use and interpret Cp in...Ch. 13.7 - For a process that is in control and follows a...Ch. 13.7 - Find the specification spread for each of the...Ch. 13.7 - Find (or estimate) the process spread for each of...Ch. 13.7 - Find the value of Cp for each of the following...Ch. 13.7 - Upper specification limit of a process. An...Ch. 13.7 - Capability of an in-control process. A process is...Ch. 13.7 - Water use at a thermal power plant. Thermal power...Ch. 13.7 - Cereal box filling process. Refer to the data on...Ch. 13.7 - Military aircraft bolts. Refer to Exercise 13.22...Ch. 13.7 - Bioreactor production of antibodies. Benchtop...Ch. 13.7 - Driver gear bore holes. During the manufacture of...Ch. 13.7 - Lowering the thickness of an expensive blow-molded...Ch. 13 - Define quality and list its important dimensions.Ch. 13 - What is a process? Give an example of an...Ch. 13 - What is a system? Give an example of a system with...Ch. 13 - Describe the six major sources of process...Ch. 13 - Suppose all the output of a process over the last...Ch. 13 - Processes that are in control are predictable;...Ch. 13 - Compare and contrast special and common causes...Ch. 13 - Explain the difference between control limits and...Ch. 13 - Should control charts be used to monitor a process...Ch. 13 - Under what circumstances is it appropriate to use...Ch. 13 - A process is under control and follows a normal...Ch. 13 - Weight of a product. Consider the time series data...Ch. 13 - Lengths of pencils. The length measurements of 20...Ch. 13 - Applying pattern-analysis rules. Use the...Ch. 13 - Defective plastic mold. A company that...Ch. 13 - Robotics clamp gap width. Control chart...Ch. 13 - Package sorting time. AirExpress. an overnight...Ch. 13 - Waiting times of airline passengers. Officials at...Ch. 13 - Defects in graphite shafts. Over the last year, a...Ch. 13 - New iron-making process. Mining Engineering...Ch. 13 - CPU of a computer chip. The central processing...Ch. 13 - Bayfield Mud Company case. The text Quantitative...
Knowledge Booster


Learn more about
Need a deep-dive on the concept behind this application? Look no further. Learn more about this topic, economics and related others by exploring similar questions and additional content below.Similar questions
- Stealth bank has deposits of $700 million. It holds reserves of $20 million and has purchased government bonds worth $350 million. The banks loans, if sold at current market value, would be worth $600 million. What is the total value of Stealth bank's assets? I believe my calculation of 1.3 billion may be incorrect May I have my work checked pleasearrow_forwardThe following graph shows the downward-sloping demand curve for Oiram-46, a monopolist producing unique magic hats. The graph also shows Oiram-46's marginal revenue curve and its average total cost curve. On the following graph, use the orange point (square symbol) to indicate the profit-maximizing quantity. Use the blue point (circle symbol) to indicate the profit-maximizing price. Use the purple point (diamond symbol) to indicate the average total cost. Use the tan rectangle (dash symbol) to show Oiram-46's total revenue and the grey rectangle (star symbol) to show its total cost. PRICE (Dollars per magic hat) 2 0 20 Marginal Cost 18 ATC 16 Profit-Maximizing Quantity 14 12 Profit-Maximizing Price MC 8 Demand 02 4 6 8 10 12 14 16 18 20 QUANTITY (Magic hats per week) Based on the graph, Oiram-46's profit is equal to 5 TOTAL SCORE: 1/4 Average Total Cost Total Revenue Total Cost Grade Step 2 (to complete this step and unlock the next step)arrow_forwardExplain information regarding the effective interest rates being charged and how much higher the rent-to-own stores’ cash price exceeded the price of the identical item at a reputable retail outlet.arrow_forward
- How can Rent-to-own industries avoid the restrictions on interest rates? Explain.arrow_forwardExplain why rent-to-own operations are so attractive to so many people compared to saving the money to buy the desired item or going to a thrift store to acquire the item?arrow_forwardExplain the business practices of the rent-to-own industry.arrow_forward
arrow_back_ios
SEE MORE QUESTIONS
arrow_forward_ios
Recommended textbooks for you
 Managerial Economics: A Problem Solving ApproachEconomicsISBN:9781337106665Author:Luke M. Froeb, Brian T. McCann, Michael R. Ward, Mike ShorPublisher:Cengage Learning
 Economics (MindTap Course List)EconomicsISBN:9781337617383Author:Roger A. ArnoldPublisher:Cengage Learning
 Managerial Economics: Applications, Strategies an...EconomicsISBN:9781305506381Author:James R. McGuigan, R. Charles Moyer, Frederick H.deB. HarrisPublisher:Cengage Learning

Managerial Economics: A Problem Solving Approach
Economics
ISBN:9781337106665
Author:Luke M. Froeb, Brian T. McCann, Michael R. Ward, Mike Shor
Publisher:Cengage Learning
Economics (MindTap Course List)
Economics
ISBN:9781337617383
Author:Roger A. Arnold
Publisher:Cengage Learning
Managerial Economics: Applications, Strategies an...
Economics
ISBN:9781305506381
Author:James R. McGuigan, R. Charles Moyer, Frederick H.deB. Harris
Publisher:Cengage Learning
Sampling Methods and Bias with Surveys: Crash Course Statistics #10; Author: CrashCourse;https://www.youtube.com/watch?v=Rf-fIpB4D50;License: Standard YouTube License, CC-BY
Statistics: Sampling Methods; Author: Mathispower4u;https://www.youtube.com/watch?v=s6ApdTvgvOs;License: Standard YouTube License, CC-BY