
Concept explainers
Videos
Pain Medication
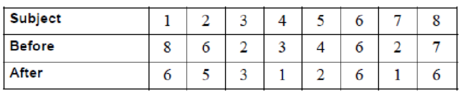
A researcher decides to see how effective a pain medication is. Eight randomly selected subjects were asked to determine the severity of their pain by using a scale of 1 to 10, with 1 being very minor and 10 being very severe. Then each was given the medication, and after 1 hour, they were asked to rate the severity of their pain, using the same scale.
1. What is the purpose of the study?
2. Are the samples independent or dependent?
3. What are the hypotheses?
4. What nonparametric test could be used to test the claim?
5. What significance level would you use?
6. What is your decision?
7. What parametric test could you use?
8. Would the results be the same?
1.
To explain: The purpose of the study.
Answer to Problem 1AC
The purpose of the study is to determine how effective the pain medication is.
Explanation of Solution
Justification:
The researcher had conducted a study for seeing the effectiveness of the pain medication and selected the subjects randomly and recorded on a scale of 1 to 10 about the severity of the pain. This implies that the purpose of the study is to know about the pain medication effectiveness.
Thus, the purpose of the study is to determine how effective the pain medication is.
2.
To explain: Whether the samples are independent or dependent.
Answer to Problem 1AC
The samples are dependent samples.
Explanation of Solution
Justification:
In this study the researcher has randomly selected 8 subjects to determine about the effectiveness of the pain medication. First the eight subjects are asked to give the scale about the pain and after one hour the same subjects are asked to give the scale based on the pain medication. This implies that the same subjects are treated twice for the study and the scale is recorded, and the samples are dependent samples.
Thus, the samples are dependent samples.
3.
To give: the hypotheses for the test.
Explanation of Solution
Justification:
The claim of the study is to determine the effectiveness of the pain medication. The hypotheses for the test are,
Null hypothesis:
Alternative hypothesis:
4.
What parametric test that can be used to test the claim.
Answer to Problem 1AC
The parametric test that can be used to test the claim is Wilcoxon signed rank test.
Explanation of Solution
Justification:
Wilcoxon sign rank test:
The Wilcoxon sign rank test is a non-parametric test that is used to compare ranks the population means of the paired samples or the matched samples. This implies that the Wilcoxon sign rank test is used to compare the matched pair groups that is, the same sample is measured two times. Wilcoxon signed-rank is used for testing two samples of the dependent groups come from the population having same distribution or not.
In this study the same subjects are treated before and after the medication and the samples are dependent samples.
Thus, the parametric test that can be used to test the claim is Wilcoxon signed rank test.
5.
What significance level that is used.
Answer to Problem 1AC
The significance level that can be used is 0.05.
Explanation of Solution
Justification:
In general when the confidence level is not mentioned the level that is used for any of the hypotheses testing is 95% and the level of significance is 0.05.
Thus, the significance level that can be used is 0.05.
6.
The decision of the study.
Answer to Problem 1AC
The Null hypothesis is rejected.
Explanation of Solution
Calculation:
Critical value:
The data represent the value for
From Table K, The Wilcoxon Signed-Rank Test, the critical value for
Hence, the critical value for is 6.
The sum of the signed ranks is obtained below:
| Before | After | Difference
|
Absolute value
|
Rank | Signed rank |
| 8 | 6 | 2 | 2 | 6 | 6 |
| 6 | 5 | 1 | 1 | 2.5 | 2.5 |
| 2 | 3 | –1 | 1 | 2.5 | –2.5 |
| 3 | 1 | 2 | 2 | 6 | 6 |
| 4 | 2 | 2 | 2 | 6 | 6 |
| 6 | 6 | 0 | 0 | – | – |
| 2 | 1 | 1 | 1 | 2.5 | 2.5 |
| 7 | 6 | –1 | 1 | 2.5 | –2.5 |
The sum of minus ranks is,
The sum of plus ranks is,
The test value is 5 which are taken as the smallest absolute values of the sums.
Thus, the test value is
Decision Rule:
If the test value is less than the critical value, then reject the null hypothesis
Conclusion:
It is clear that the critical value is 6 and the test value is 5.
Here, the test value is less than the critical value.
Therefore, by the rule, the null hypothesis
There is sufficient evidence to reject the claim that “the severity of the pain after medication is less than before the medication”.
7.
Which parametric test that can be used.
Answer to Problem 1AC
The parametric test that can be used is paired t test.
Explanation of Solution
In nonparametric tests the Wilcoxon signed rank test is used for testing two dependent samples. Likewise in parametric tests the paired t test is used to test the difference between two populations for dependent samples.
Thus, the parametric test that can be used is paired t test.
8.
Whether the results are same or not.
Answer to Problem 1AC
Yes, the results would be same.
Explanation of Solution
When the same data is used for testing for parametric paired t test the results would be same as obtained from nonparametric tests. But, the results obtained would be appropriate only if the assumptions for the parametric paired t test are satisfied.
Thus, the results would be the same.
Want to see more full solutions like this?
Chapter 13 Solutions
Elementary Statistics: A Step-by-Step Approach with Formula Card
Additional Math Textbook Solutions
APPLIED STAT.IN BUS.+ECONOMICS
Calculus: Early Transcendentals (2nd Edition)
Introductory Statistics
Elementary Statistics ( 3rd International Edition ) Isbn:9781260092561
Elementary Statistics: Picturing the World (7th Edition)
Graphical Approach To College Algebra


- Question 4 An article in Quality Progress (May 2011, pp. 42-48) describes the use of factorial experiments to improve a silver powder production process. This product is used in conductive pastes to manufacture a wide variety of products ranging from silicon wafers to elastic membrane switches. Powder density (g/cm²) and surface area (cm/g) are the two critical characteristics of this product. The experiments involved three factors: reaction temperature, ammonium percentage, stirring rate. Each of these factors had two levels, and the design was replicated twice. The design is shown in Table 3. A222222222222233 Stir Rate (RPM) Ammonium (%) Table 3: Silver Powder Experiment from Exercise 13.23 Temperature (°C) Density Surface Area 100 8 14.68 0.40 100 8 15.18 0.43 30 100 8 15.12 0.42 30 100 17.48 0.41 150 7.54 0.69 150 8 6.66 0.67 30 150 8 12.46 0.52 30 150 8 12.62 0.36 100 40 10.95 0.58 100 40 17.68 0.43 30 100 40 12.65 0.57 30 100 40 15.96 0.54 150 40 8.03 0.68 150 40 8.84 0.75 30 150…arrow_forward- + ++ Table 2: Crack Experiment for Exercise 2 A B C D Treatment Combination (1) Replicate I II 7.037 6.376 14.707 15.219 |++++ 1 བྱ॰༤༠སྦྱོ སྦྱོཋཏྟཱུ a b ab 11.635 12.089 17.273 17.815 с ас 10.403 10.151 4.368 4.098 bc abc 9.360 9.253 13.440 12.923 d 8.561 8.951 ad 16.867 17.052 bd 13.876 13.658 abd 19.824 19.639 cd 11.846 12.337 acd 6.125 5.904 bcd 11.190 10.935 abcd 15.653 15.053 Question 3 Continuation of Exercise 2. One of the variables in the experiment described in Exercise 2, heat treatment method (C), is a categorical variable. Assume that the remaining factors are continuous. (a) Write two regression models for predicting crack length, one for each level of the heat treatment method variable. What differences, if any, do you notice in these two equations? (b) Generate appropriate response surface contour plots for the two regression models in part (a). (c) What set of conditions would you recommend for the factors A, B, and D if you use heat treatment method C = +? (d) Repeat…arrow_forwardQuestion 2 A nickel-titanium alloy is used to make components for jet turbine aircraft engines. Cracking is a potentially serious problem in the final part because it can lead to nonrecoverable failure. A test is run at the parts producer to determine the effect of four factors on cracks. The four factors are: pouring temperature (A), titanium content (B), heat treatment method (C), amount of grain refiner used (D). Two replicates of a 24 design are run, and the length of crack (in mm x10-2) induced in a sample coupon subjected to a standard test is measured. The data are shown in Table 2. 1 (a) Estimate the factor effects. Which factor effects appear to be large? (b) Conduct an analysis of variance. Do any of the factors affect cracking? Use a = 0.05. (c) Write down a regression model that can be used to predict crack length as a function of the significant main effects and interactions you have identified in part (b). (d) Analyze the residuals from this experiment. (e) Is there an…arrow_forward
- A 24-1 design has been used to investigate the effect of four factors on the resistivity of a silicon wafer. The data from this experiment are shown in Table 4. Table 4: Resistivity Experiment for Exercise 5 Run A B с D Resistivity 1 23 2 3 4 5 6 7 8 9 10 11 12 I+I+I+I+Oooo 0 0 ||++TI++o000 33.2 4.6 31.2 9.6 40.6 162.4 39.4 158.6 63.4 62.6 58.7 0 0 60.9 3 (a) Estimate the factor effects. Plot the effect estimates on a normal probability scale. (b) Identify a tentative model for this process. Fit the model and test for curvature. (c) Plot the residuals from the model in part (b) versus the predicted resistivity. Is there any indication on this plot of model inadequacy? (d) Construct a normal probability plot of the residuals. Is there any reason to doubt the validity of the normality assumption?arrow_forwardStem1: 1,4 Stem 2: 2,4,8 Stem3: 2,4 Stem4: 0,1,6,8 Stem5: 0,1,2,3,9 Stem 6: 2,2 What’s the Min,Q1, Med,Q3,Max?arrow_forwardAre the t-statistics here greater than 1.96? What do you conclude? colgPA= 1.39+0.412 hsGPA (.33) (0.094) Find the P valuearrow_forward
- A poll before the elections showed that in a given sample 79% of people vote for candidate C. How many people should be interviewed so that the pollsters can be 99% sure that from 75% to 83% of the population will vote for candidate C? Round your answer to the whole number.arrow_forwardSuppose a random sample of 459 married couples found that 307 had two or more personality preferences in common. In another random sample of 471 married couples, it was found that only 31 had no preferences in common. Let p1 be the population proportion of all married couples who have two or more personality preferences in common. Let p2 be the population proportion of all married couples who have no personality preferences in common. Find a95% confidence interval for . Round your answer to three decimal places.arrow_forwardA history teacher interviewed a random sample of 80 students about their preferences in learning activities outside of school and whether they are considering watching a historical movie at the cinema. 69 answered that they would like to go to the cinema. Let p represent the proportion of students who want to watch a historical movie. Determine the maximal margin of error. Use α = 0.05. Round your answer to three decimal places. arrow_forward
- A random sample of medical files is used to estimate the proportion p of all people who have blood type B. If you have no preliminary estimate for p, how many medical files should you include in a random sample in order to be 99% sure that the point estimate will be within a distance of 0.07 from p? Round your answer to the next higher whole number.arrow_forwardA clinical study is designed to assess the average length of hospital stay of patients who underwent surgery. A preliminary study of a random sample of 70 surgery patients’ records showed that the standard deviation of the lengths of stay of all surgery patients is 7.5 days. How large should a sample to estimate the desired mean to within 1 day at 95% confidence? Round your answer to the whole number.arrow_forwardA clinical study is designed to assess the average length of hospital stay of patients who underwent surgery. A preliminary study of a random sample of 70 surgery patients’ records showed that the standard deviation of the lengths of stay of all surgery patients is 7.5 days. How large should a sample to estimate the desired mean to within 1 day at 95% confidence? Round your answer to the whole number.arrow_forward
 Big Ideas Math A Bridge To Success Algebra 1: Stu...AlgebraISBN:9781680331141Author:HOUGHTON MIFFLIN HARCOURTPublisher:Houghton Mifflin Harcourt
 Holt Mcdougal Larson Pre-algebra: Student Edition...AlgebraISBN:9780547587776Author:HOLT MCDOUGALPublisher:HOLT MCDOUGAL
 Glencoe Algebra 1, Student Edition, 9780079039897...AlgebraISBN:9780079039897Author:CarterPublisher:McGraw Hill