
Concept explainers
Videos
Pain Medication
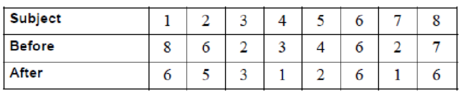
A researcher decides to see how effective a pain medication is. Eight randomly selected subjects were asked to determine the severity of their pain by using a scale of 1 to 10, with 1 being very minor and 10 being very severe. Then each was given the medication, and after 1 hour, they were asked to rate the severity of their pain, using the same scale.
1. What is the purpose of the study?
2. Are the samples independent or dependent?
3. What are the hypotheses?
4. What nonparametric test could be used to test the claim?
5. What significance level would you use?
6. What is your decision?
7. What parametric test could you use?
8. Would the results be the same?
1.
To explain: The purpose of the study.
Answer to Problem 1AC
The purpose of the study is to determine how effective the pain medication is.
Explanation of Solution
Justification:
The researcher had conducted a study for seeing the effectiveness of the pain medication and selected the subjects randomly and recorded on a scale of 1 to 10 about the severity of the pain. This implies that the purpose of the study is to know about the pain medication effectiveness.
Thus, the purpose of the study is to determine how effective the pain medication is.
2.
To explain: Whether the samples are independent or dependent.
Answer to Problem 1AC
The samples are dependent samples.
Explanation of Solution
Justification:
In this study the researcher has randomly selected 8 subjects to determine about the effectiveness of the pain medication. First the eight subjects are asked to give the scale about the pain and after one hour the same subjects are asked to give the scale based on the pain medication. This implies that the same subjects are treated twice for the study and the scale is recorded, and the samples are dependent samples.
Thus, the samples are dependent samples.
3.
To give: the hypotheses for the test.
Explanation of Solution
Justification:
The claim of the study is to determine the effectiveness of the pain medication. The hypotheses for the test are,
Null hypothesis:
Alternative hypothesis:
4.
What parametric test that can be used to test the claim.
Answer to Problem 1AC
The parametric test that can be used to test the claim is Wilcoxon signed rank test.
Explanation of Solution
Justification:
Wilcoxon sign rank test:
The Wilcoxon sign rank test is a non-parametric test that is used to compare ranks the population means of the paired samples or the matched samples. This implies that the Wilcoxon sign rank test is used to compare the matched pair groups that is, the same sample is measured two times. Wilcoxon signed-rank is used for testing two samples of the dependent groups come from the population having same distribution or not.
In this study the same subjects are treated before and after the medication and the samples are dependent samples.
Thus, the parametric test that can be used to test the claim is Wilcoxon signed rank test.
5.
What significance level that is used.
Answer to Problem 1AC
The significance level that can be used is 0.05.
Explanation of Solution
Justification:
In general when the confidence level is not mentioned the level that is used for any of the hypotheses testing is 95% and the level of significance is 0.05.
Thus, the significance level that can be used is 0.05.
6.
The decision of the study.
Answer to Problem 1AC
The Null hypothesis is rejected.
Explanation of Solution
Calculation:
Critical value:
The data represent the value for
From Table K, The Wilcoxon Signed-Rank Test, the critical value for
Hence, the critical value for is 6.
The sum of the signed ranks is obtained below:
| Before | After | Difference
|
Absolute value
|
Rank | Signed rank |
| 8 | 6 | 2 | 2 | 6 | 6 |
| 6 | 5 | 1 | 1 | 2.5 | 2.5 |
| 2 | 3 | –1 | 1 | 2.5 | –2.5 |
| 3 | 1 | 2 | 2 | 6 | 6 |
| 4 | 2 | 2 | 2 | 6 | 6 |
| 6 | 6 | 0 | 0 | – | – |
| 2 | 1 | 1 | 1 | 2.5 | 2.5 |
| 7 | 6 | –1 | 1 | 2.5 | –2.5 |
The sum of minus ranks is,
The sum of plus ranks is,
The test value is 5 which are taken as the smallest absolute values of the sums.
Thus, the test value is
Decision Rule:
If the test value is less than the critical value, then reject the null hypothesis
Conclusion:
It is clear that the critical value is 6 and the test value is 5.
Here, the test value is less than the critical value.
Therefore, by the rule, the null hypothesis
There is sufficient evidence to reject the claim that “the severity of the pain after medication is less than before the medication”.
7.
Which parametric test that can be used.
Answer to Problem 1AC
The parametric test that can be used is paired t test.
Explanation of Solution
In nonparametric tests the Wilcoxon signed rank test is used for testing two dependent samples. Likewise in parametric tests the paired t test is used to test the difference between two populations for dependent samples.
Thus, the parametric test that can be used is paired t test.
8.
Whether the results are same or not.
Answer to Problem 1AC
Yes, the results would be same.
Explanation of Solution
When the same data is used for testing for parametric paired t test the results would be same as obtained from nonparametric tests. But, the results obtained would be appropriate only if the assumptions for the parametric paired t test are satisfied.
Thus, the results would be the same.
Want to see more full solutions like this?
Chapter 13 Solutions
ELEMENTARY STATISTICS CONNECT CODE>CUS
Additional Math Textbook Solutions
APPLIED STAT.IN BUS.+ECONOMICS
Calculus: Early Transcendentals (2nd Edition)
Introductory Statistics
Elementary Statistics ( 3rd International Edition ) Isbn:9781260092561
Elementary Statistics: Picturing the World (7th Edition)
Graphical Approach To College Algebra


- Examine the Variables: Carefully review and note the names of all variables in the dataset. Examples of these variables include: Mileage (mpg) Number of Cylinders (cyl) Displacement (disp) Horsepower (hp) Research: Google to understand these variables. Statistical Analysis: Select mpg variable, and perform the following statistical tests. Once you are done with these tests using mpg variable, repeat the same with hp Mean Median First Quartile (Q1) Second Quartile (Q2) Third Quartile (Q3) Fourth Quartile (Q4) 10th Percentile 70th Percentile Skewness Kurtosis Document Your Results: In RStudio: Before running each statistical test, provide a heading in the format shown at the bottom. “# Mean of mileage – Your name’s command” In Microsoft Word: Once you've completed all tests, take a screenshot of your results in RStudio and paste it into a Microsoft Word document. Make sure that snapshots are very clear. You will need multiple snapshots. Also transfer these results to the…arrow_forwardExamine the Variables: Carefully review and note the names of all variables in the dataset. Examples of these variables include: Mileage (mpg) Number of Cylinders (cyl) Displacement (disp) Horsepower (hp) Research: Google to understand these variables. Statistical Analysis: Select mpg variable, and perform the following statistical tests. Once you are done with these tests using mpg variable, repeat the same with hp Mean Median First Quartile (Q1) Second Quartile (Q2) Third Quartile (Q3) Fourth Quartile (Q4) 10th Percentile 70th Percentile Skewness Kurtosis Document Your Results: In RStudio: Before running each statistical test, provide a heading in the format shown at the bottom. “# Mean of mileage – Your name’s command” In Microsoft Word: Once you've completed all tests, take a screenshot of your results in RStudio and paste it into a Microsoft Word document. Make sure that snapshots are very clear. You will need multiple snapshots. Also transfer these results to the…arrow_forward2 (VaR and ES) Suppose X1 are independent. Prove that ~ Unif[-0.5, 0.5] and X2 VaRa (X1X2) < VaRa(X1) + VaRa (X2). ~ Unif[-0.5, 0.5]arrow_forward
- 8 (Correlation and Diversification) Assume we have two stocks, A and B, show that a particular combination of the two stocks produce a risk-free portfolio when the correlation between the return of A and B is -1.arrow_forward9 (Portfolio allocation) Suppose R₁ and R2 are returns of 2 assets and with expected return and variance respectively r₁ and 72 and variance-covariance σ2, 0%½ and σ12. Find −∞ ≤ w ≤ ∞ such that the portfolio wR₁ + (1 - w) R₂ has the smallest risk.arrow_forward7 (Multivariate random variable) Suppose X, €1, €2, €3 are IID N(0, 1) and Y2 Y₁ = 0.2 0.8X + €1, Y₂ = 0.3 +0.7X+ €2, Y3 = 0.2 + 0.9X + €3. = (In models like this, X is called the common factors of Y₁, Y₂, Y3.) Y = (Y1, Y2, Y3). (a) Find E(Y) and cov(Y). (b) What can you observe from cov(Y). Writearrow_forward
- 1 (VaR and ES) Suppose X ~ f(x) with 1+x, if 0> x > −1 f(x) = 1−x if 1 x > 0 Find VaRo.05 (X) and ES0.05 (X).arrow_forwardJoy is making Christmas gifts. She has 6 1/12 feet of yarn and will need 4 1/4 to complete our project. How much yarn will she have left over compute this solution in two different ways arrow_forwardSolve for X. Explain each step. 2^2x • 2^-4=8arrow_forward
- One hundred people were surveyed, and one question pertained to their educational background. The results of this question and their genders are given in the following table. Female (F) Male (F′) Total College degree (D) 30 20 50 No college degree (D′) 30 20 50 Total 60 40 100 If a person is selected at random from those surveyed, find the probability of each of the following events.1. The person is female or has a college degree. Answer: equation editor Equation Editor 2. The person is male or does not have a college degree. Answer: equation editor Equation Editor 3. The person is female or does not have a college degree.arrow_forwardneed help with part barrow_forwardSuppose you know that Bob's test score is above the mean, but he doesn't remember by how much. At least how many students must score lower than Bob?arrow_forward
 Big Ideas Math A Bridge To Success Algebra 1: Stu...AlgebraISBN:9781680331141Author:HOUGHTON MIFFLIN HARCOURTPublisher:Houghton Mifflin Harcourt
 Holt Mcdougal Larson Pre-algebra: Student Edition...AlgebraISBN:9780547587776Author:HOLT MCDOUGALPublisher:HOLT MCDOUGAL
 Glencoe Algebra 1, Student Edition, 9780079039897...AlgebraISBN:9780079039897Author:CarterPublisher:McGraw Hill