
Elementary Statistics - Excel Statistics Laboratory Manual
13th Edition
ISBN: 9780134464275
Author: Triola
Publisher: PEARSON
expand_more
expand_more
format_list_bulleted
Videos
Textbook Question
Chapter 13.2, Problem 5BSC
Matched Pairs. In Exercises 5–8, use the sign test for the data consisting of matched pairs.
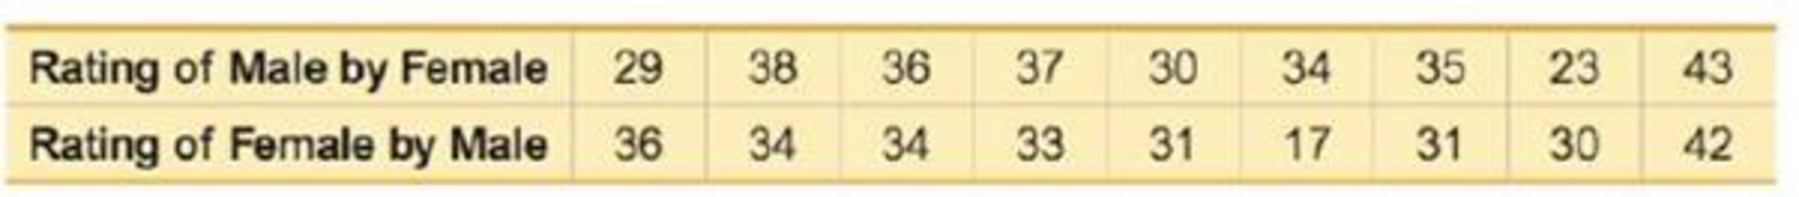
5. Speed Dating: Attributes Listed below are “attribute” ratings made by couples participating in a speed dating session. Each attribute rating is the sum of the ratings of five attributes (sincerity, intelligence, fun, ambition, shared interests). The listed ratings are from Data Set 18 “Speed Dating” in Appendix B. Use a 0.05 significance level to test the claim that there is a difference between female attribute ratings and male attribute ratings.
Expert Solution & Answer
Want to see the full answer?
Check out a sample textbook solution
Students have asked these similar questions
Task Description:
Read the following case study and answer the questions that follow.
Ella is a 9-year-old third-grade student in an inclusive classroom. She has been diagnosed with Emotional and Behavioural Disorder (EBD). She has been struggling academically and socially due to
challenges related to self-regulation, impulsivity, and emotional outbursts. Ella's behaviour includes frequent tantrums, defiance toward authority figures, and difficulty forming positive relationships with peers. Despite her challenges, Ella shows an interest in art and creative activities and demonstrates strong verbal skills when calm.
Describe 2 strategies that could be implemented that could help Ella regulate her emotions in class (4 marks)
Explain 2 strategies that could improve Ella’s social skills (4 marks)
Identify 2 accommodations that could be implemented to support Ella academic progress and provide a rationale for your recommendation.(6 marks)
Provide a detailed explanation of 2 ways…
Question 2: When John started his first job, his first end-of-year salary was $82,500. In the following years, he received salary raises as shown in the following table.
Fill the Table: Fill the following table showing his end-of-year salary for each year. I have already provided the end-of-year salaries for the first three years. Calculate the end-of-year salaries for the remaining years using Excel. (If you Excel answer for the top 3 cells is not the same as the one in the following table, your formula / approach is incorrect) (2 points)
Geometric Mean of Salary Raises: Calculate the geometric mean of the salary raises using the percentage figures provided in the second column named “% Raise”. (The geometric mean for this calculation should be nearly identical to the arithmetic mean. If your answer deviates significantly from the mean, it's likely incorrect. 2 points)
Starting salary
% Raise
Raise
Salary after raise
75000
10%
7500
82500
82500
4%
3300…
I need help with this problem and an explanation of the solution for the image described below. (Statistics: Engineering Probabilities)
Chapter 13 Solutions
Elementary Statistics - Excel Statistics Laboratory Manual
Ch. 13.2 - Prob. 1BSCCh. 13.2 - Prob. 2BSCCh. 13.2 - Contradicting H1 An important step in conducting...Ch. 13.2 - Efficiency of the Sign Test Refer to Table 13-2 on...Ch. 13.2 - Matched Pairs. In Exercises 58, use the sign test...Ch. 13.2 - Matched Pairs. In Exercises 58, use the sign test...Ch. 13.2 - Matched Pairs. In Exercises 58, use the sign test...Ch. 13.2 - Matched Pairs. In Exercises 58, use the sign test...Ch. 13.2 - Nominal Data. In Exercises 912, use the sign test...Ch. 13.2 - Nominal Data. In Exercises 912, use the sign test...
Ch. 13.2 - Nominal Data. In Exercises 912, use the sign test...Ch. 13.2 - Nominal Data. In Exercises 912, use the sign test...Ch. 13.2 - Appendix B Data Sets. In Exercises 1316, refer to...Ch. 13.2 - Appendix B Data Sets. In Exercises 1316, refer to...Ch. 13.2 - Appendix B Data Sets. In Exercises 1316, refer to...Ch. 13.2 - Appendix B Data Sets. In Exercises 1316, refer to...Ch. 13.2 - Procedures for Handling Ties In the sign lest...Ch. 13.2 - Finding Critical Values Table A-7 lists critical...Ch. 13.3 - Wilcoxon Signed-Ranks Test for Body Temperatures...Ch. 13.3 - Prob. 2BSCCh. 13.3 - Prob. 3BSCCh. 13.3 - Prob. 4BSCCh. 13.3 - Using the Wilcoxon Signed-Ranks Test. In Exercises...Ch. 13.3 - Using the Wilcoxon Signed-Ranks Test. In Exercises...Ch. 13.3 - Using the Wilcoxon Signed-Ranks Test. In Exercises...Ch. 13.3 - Using the Wilcoxon Signed-Ranks Test. In Exercises...Ch. 13.3 - Prob. 9BSCCh. 13.3 - Prob. 10BSCCh. 13.3 - Prob. 11BSCCh. 13.3 - Prob. 12BSCCh. 13.3 - Rank Sums Exercise 12 uses Data Set 23 Old...Ch. 13.4 - Prob. 1BSCCh. 13.4 - Rank Sum After ranking the combined list of...Ch. 13.4 - Prob. 3BSCCh. 13.4 - Prob. 4BSCCh. 13.4 - Wilcoxon Rank-Sum Test. In Exercises 58, use the...Ch. 13.4 - Wilcoxon Rank-Sum Test. In Exercises 58, use the...Ch. 13.4 - Wilcoxon Rank-Sum Test. In Exercises 58, use the...Ch. 13.4 - Wilcoxon Rank-Sum Test. In Exercises 58, use the...Ch. 13.4 - Prob. 9BSCCh. 13.4 - Appendix B Data Sets. In Exercises 912, refer to...Ch. 13.4 - Appendix B Data Sets. In Exercises 912, refer to...Ch. 13.4 - Appendix B Data Sets. In Exercises 912, refer to...Ch. 13.4 - Prob. 13BBCh. 13.4 - Finding Critical Values Assume that we have two...Ch. 13.5 - Prob. 1BSCCh. 13.5 - Requirements Assume that we want to use the data...Ch. 13.5 - Notation For the data given in Exercise 1,...Ch. 13.5 - Efficiency Refer to Table 13-2 on page 600 and...Ch. 13.5 - Prob. 5BSCCh. 13.5 - Prob. 6BSCCh. 13.5 - Prob. 7BSCCh. 13.5 - Prob. 8BSCCh. 13.5 - Appendix B Data Sets. In Exercises 912, use the...Ch. 13.5 - Prob. 10BSCCh. 13.5 - Appendix B Data Sets. In Exercises 912, use the...Ch. 13.5 - Appendix B Data Sets. In Exercises 912, use the...Ch. 13.5 - Correcting the H Test Statistic for Ties In using...Ch. 13.6 - Regression If the methods of this section are used...Ch. 13.6 - Level of Measurement Which of the levels of...Ch. 13.6 - Notation What do r, rs , and ps denote? Why is the...Ch. 13.6 - Prob. 4BSCCh. 13.6 - In Exercises 5 and 6, use the scatterplot to find...Ch. 13.6 - In Exercises 5 and 6, use the scatterplot to find...Ch. 13.6 - Testing for Rank Correlation. In Exercises 712,...Ch. 13.6 - Prob. 8BSCCh. 13.6 - Testing for Rank Correlation. In Exercises 712,...Ch. 13.6 - Testing for Rank Correlation. In Exercises 712,...Ch. 13.6 - Prob. 11BSCCh. 13.6 - Testing for Rank Correlation. In Exercises 712,...Ch. 13.6 - Prob. 13BSCCh. 13.6 - Appendix B Data Sets. In Exercises 1316, use the...Ch. 13.6 - Appendix B Data Sets. In Exercises 1316, use the...Ch. 13.6 - Prob. 16BSCCh. 13.6 - Prob. 17BBCh. 13.7 - In Exercises 14, use the following sequence of...Ch. 13.7 - Prob. 2BSCCh. 13.7 - Prob. 3BSCCh. 13.7 - Prob. 4BSCCh. 13.7 - Using the Runs Test for Randomness. In Exercises...Ch. 13.7 - Prob. 6BSCCh. 13.7 - Prob. 7BSCCh. 13.7 - Using the Runs Test for Randomness. In Exercises...Ch. 13.7 - Prob. 9BSCCh. 13.7 - Prob. 10BSCCh. 13.7 - Runs Test with Large Samples. In Exercises 912,...Ch. 13.7 - Prob. 12BSCCh. 13 - Prob. 1CQQCh. 13 - Prob. 2CQQCh. 13 - Prob. 3CQQCh. 13 - Prob. 4CQQCh. 13 - Prob. 5CQQCh. 13 - Prob. 6CQQCh. 13 - Prob. 7CQQCh. 13 - Prob. 8CQQCh. 13 - Prob. 9CQQCh. 13 - Which Test? Three different judges give the same...Ch. 13 - Prob. 1RECh. 13 - Using Nonparametric Tests. In Exercises 110, use a...Ch. 13 - Prob. 3RECh. 13 - Prob. 4RECh. 13 - Prob. 5RECh. 13 - Prob. 6RECh. 13 - Using Nonparametric Tests. In Exercises 110, use a...Ch. 13 - Prob. 8RECh. 13 - Using Nonparametric Tests. In Exercises 1-10, use...Ch. 13 - Prob. 10RECh. 13 - Prob. 1CRECh. 13 - Prob. 2CRECh. 13 - In Exercises 13, use the data listed below. The...Ch. 13 - Prob. 4CRECh. 13 - Prob. 5CRECh. 13 - Prob. 6CRECh. 13 - Prob. 7CRECh. 13 - Prob. 8CRECh. 13 - Fear of Heights Among readers of a USA Today...Ch. 13 - Cell Phones and Crashes: Analyzing Newspaper...Ch. 13 - Prob. 1TPCh. 13 - Prob. 1FDD
Knowledge Booster


Learn more about
Need a deep-dive on the concept behind this application? Look no further. Learn more about this topic, statistics and related others by exploring similar questions and additional content below.Similar questions
- I need help with this problem and an explanation of the solution for the image described below. (Statistics: Engineering Probabilities)arrow_forward310015 K Question 9, 5.2.28-T Part 1 of 4 HW Score: 85.96%, 49 of 57 points Points: 1 Save of 6 Based on a poll, among adults who regret getting tattoos, 28% say that they were too young when they got their tattoos. Assume that six adults who regret getting tattoos are randomly selected, and find the indicated probability. Complete parts (a) through (d) below. a. Find the probability that none of the selected adults say that they were too young to get tattoos. 0.0520 (Round to four decimal places as needed.) Clear all Final check Feb 7 12:47 US Oarrow_forwardhow could the bar graph have been organized differently to make it easier to compare opinion changes within political partiesarrow_forward
- 30. An individual who has automobile insurance from a certain company is randomly selected. Let Y be the num- ber of moving violations for which the individual was cited during the last 3 years. The pmf of Y isy | 1 2 4 8 16p(y) | .05 .10 .35 .40 .10 a.Compute E(Y).b. Suppose an individual with Y violations incurs a surcharge of $100Y^2. Calculate the expected amount of the surcharge.arrow_forward24. An insurance company offers its policyholders a num- ber of different premium payment options. For a ran- domly selected policyholder, let X = the number of months between successive payments. The cdf of X is as follows: F(x)=0.00 : x < 10.30 : 1≤x<30.40 : 3≤ x < 40.45 : 4≤ x <60.60 : 6≤ x < 121.00 : 12≤ x a. What is the pmf of X?b. Using just the cdf, compute P(3≤ X ≤6) and P(4≤ X).arrow_forward59. At a certain gas station, 40% of the customers use regular gas (A1), 35% use plus gas (A2), and 25% use premium (A3). Of those customers using regular gas, only 30% fill their tanks (event B). Of those customers using plus, 60% fill their tanks, whereas of those using premium, 50% fill their tanks.a. What is the probability that the next customer will request plus gas and fill the tank (A2 B)?b. What is the probability that the next customer fills the tank?c. If the next customer fills the tank, what is the probability that regular gas is requested? Plus? Premium?arrow_forward
- 38. Possible values of X, the number of components in a system submitted for repair that must be replaced, are 1, 2, 3, and 4 with corresponding probabilities .15, .35, .35, and .15, respectively. a. Calculate E(X) and then E(5 - X).b. Would the repair facility be better off charging a flat fee of $75 or else the amount $[150/(5 - X)]? [Note: It is not generally true that E(c/Y) = c/E(Y).]arrow_forward74. The proportions of blood phenotypes in the U.S. popula- tion are as follows:A B AB O .40 .11 .04 .45 Assuming that the phenotypes of two randomly selected individuals are independent of one another, what is the probability that both phenotypes are O? What is the probability that the phenotypes of two randomly selected individuals match?arrow_forward53. A certain shop repairs both audio and video compo- nents. Let A denote the event that the next component brought in for repair is an audio component, and let B be the event that the next component is a compact disc player (so the event B is contained in A). Suppose that P(A) = .6 and P(B) = .05. What is P(BA)?arrow_forward
arrow_back_ios
SEE MORE QUESTIONS
arrow_forward_ios
Recommended textbooks for you
 Glencoe Algebra 1, Student Edition, 9780079039897...AlgebraISBN:9780079039897Author:CarterPublisher:McGraw Hill
 Big Ideas Math A Bridge To Success Algebra 1: Stu...AlgebraISBN:9781680331141Author:HOUGHTON MIFFLIN HARCOURTPublisher:Houghton Mifflin Harcourt
 Holt Mcdougal Larson Pre-algebra: Student Edition...AlgebraISBN:9780547587776Author:HOLT MCDOUGALPublisher:HOLT MCDOUGAL
Glencoe Algebra 1, Student Edition, 9780079039897...
Algebra
ISBN:9780079039897
Author:Carter
Publisher:McGraw Hill
Big Ideas Math A Bridge To Success Algebra 1: Stu...
Algebra
ISBN:9781680331141
Author:HOUGHTON MIFFLIN HARCOURT
Publisher:Houghton Mifflin Harcourt
Holt Mcdougal Larson Pre-algebra: Student Edition...
Algebra
ISBN:9780547587776
Author:HOLT MCDOUGAL
Publisher:HOLT MCDOUGAL
Hypothesis Testing using Confidence Interval Approach; Author: BUM2413 Applied Statistics UMP;https://www.youtube.com/watch?v=Hq1l3e9pLyY;License: Standard YouTube License, CC-BY
Hypothesis Testing - Difference of Two Means - Student's -Distribution & Normal Distribution; Author: The Organic Chemistry Tutor;https://www.youtube.com/watch?v=UcZwyzwWU7o;License: Standard Youtube License