Concept explainers
Videos
This exercise makes use of the geometric procedure just explained to calculate the variance and standard deviation of the population 2, 5, 7, 11, 15. The following figure shows the given set of data labeled on a number line, along with its mean, which is 8.
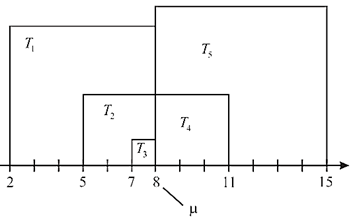
a. Draw the tile associated with each of the five data values 2, 5, 7, 11, and 15.
b. Label each tile with its area.
c Find the sum of the areas of all the tiles.
d. Find the average (mean) of the areas of all 5 tiles.
e. To the right of the above number line, draw a tile whose area is the average found in part d.
f. What is the variance of the data? What geometric figure represents the variance?
g. What is the standard deviation of the data? What geometric figure represents the standard deviation?
Want to see the full answer?
Check out a sample textbook solution
Chapter 13 Solutions
Mathematical Excursions (MindTap Course List)


- Determine all functions f analytic in the open unit disc || < 1 which satisfy in addition f(0) = 1 and |f(z)|≥ 1 whenever || < 1. Justify your answer.arrow_forwardDeduce the Laurent expansion for f(z) = 22(2-3)2 in the annulus 0 < |z3|< 3.arrow_forwardWhat can you conclude about a complex-valued function f(z) that satisfies 1. f is complex differentiable everywhere 2. ƒ(z+1) = ƒ(z) for all z 3. For a fixed complex number a with nonzero imaginary part, f(z+a) = f(z) for all z ? Justify your answer. (Hint: Use Liouville's theorem.)arrow_forward
- 6. Solve the system of differential equations using Laplace Transforms: x(t) = 3x₁ (t) + 4x2(t) x(t) = -4x₁(t) + 3x2(t) x₁(0) = 1,x2(0) = 0arrow_forward3. Determine the Laplace Transform for the following functions. Show all of your work: 1-t, 0 ≤t<3 a. e(t) = t2, 3≤t<5 4, t≥ 5 b. f(t) = f(tt)e-3(-) cos 4τ drarrow_forward4. Find the inverse Laplace Transform Show all of your work: a. F(s) = = 2s-3 (s²-10s+61)(5-3) se-2s b. G(s) = (s+2)²arrow_forward
- 1. Consider the differential equation, show all of your work: dy =(y2)(y+1) dx a. Determine the equilibrium solutions for the differential equation. b. Where is the differential equation increasing or decreasing? c. Where are the changes in concavity? d. Suppose that y(0)=0, what is the value of y as t goes to infinity?arrow_forward2. Suppose a LC circuit has the following differential equation: q'+4q=6etcos 4t, q(0) = 1 a. Find the function for q(t), use any method that we have studied in the course. b. What is the transient and the steady-state of the circuit?arrow_forward5. Use variation of parameters to find the general solution to the differential equation: y" - 6y' + 9y=e3x Inxarrow_forward
- Let the region R be the area enclosed by the function f(x) = ln (x) + 2 and g(x) = x. Write an integral in terms of x and also an integral in terms of y that would represent the area of the region R. If necessary, round limit values to the nearest thousandth. 5 4 3 2 1 y x 1 2 3 4arrow_forwardCape Fear Community Colle X ALEKS ALEKS - Dorothy Smith - Sec X www-awu.aleks.com/alekscgi/x/Isl.exe/10_u-IgNslkr7j8P3jH-IQ1w4xc5zw7yX8A9Q43nt5P1XWJWARE... Section 7.1,7.2,7.3 HW 三 Question 21 of 28 (1 point) | Question Attempt: 5 of Unlimited The proportion of phones that have more than 47 apps is 0.8783 Part: 1 / 2 Part 2 of 2 (b) Find the 70th The 70th percentile of the number of apps. Round the answer to two decimal places. percentile of the number of apps is Try again Skip Part Recheck Save 2025 Mcarrow_forwardHi, I need to sort out where I went wrong. So, please us the data attached and run four separate regressions, each using the Recruiters rating as the dependent variable and GMAT, Accept Rate, Salary, and Enrollment, respectively, as a single independent variable. Interpret this equation. Round your answers to four decimal places, if necessary. If your answer is negative number, enter "minus" sign. Equation for GMAT: Ŷ = _______ + _______ GMAT Equation for Accept Rate: Ŷ = _______ + _______ Accept Rate Equation for Salary: Ŷ = _______ + _______ Salary Equation for Enrollment: Ŷ = _______ + _______ Enrollmentarrow_forward
 Glencoe Algebra 1, Student Edition, 9780079039897...AlgebraISBN:9780079039897Author:CarterPublisher:McGraw Hill
 Big Ideas Math A Bridge To Success Algebra 1: Stu...AlgebraISBN:9781680331141Author:HOUGHTON MIFFLIN HARCOURTPublisher:Houghton Mifflin Harcourt
 Holt Mcdougal Larson Pre-algebra: Student Edition...AlgebraISBN:9780547587776Author:HOLT MCDOUGALPublisher:HOLT MCDOUGAL