
Videos
(a)
To Draw: The Stem-and-leaf plot of the data.
(a)
Answer to Problem 16PPS

Explanation of Solution
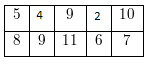
Given: Display the data in length in inches of the students in your class in frequency table.
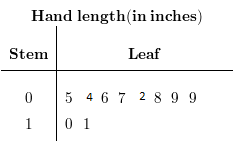
Make the stem-and-leaf plot.
Let the data recorded is
The stem-and-leaf plot of the data is shown below:
(b)
To Explain: The data.
(b)
Answer to Problem 16PPS
Mean=
Median=
Mode=
Explanation of Solution
Given: Display the data in length in inches of the students in your class in frequency table.
Analyze the data. Then write summary explaining your data.
Finding Mean:
Mean=
The number of observations is even
Thus
Median
Median=
Mode=
Chapter 13 Solutions
EP PRE-ALGEBRA-STUDENTWORKS PLUS(1 YR.)
Additional Math Textbook Solutions
Basic Business Statistics, Student Value Edition
Elementary Statistics (13th Edition)
Calculus: Early Transcendentals (2nd Edition)
Elementary Statistics: Picturing the World (7th Edition)
Introductory Statistics
Thinking Mathematically (6th Edition)


- Solve the following systems of equations and show all work.y = x2 + 3y = x + 5 Please type out answerarrow_forwardSolve the following system of equations. Show all work and solutions.y = 2x2 + 6x + 1y = −4x2 + 1 Please type out answerarrow_forwardDalia buys 20 collectible gems per month. Grace sells 10 gems from her collection of 120 each month. When will Dalia have more gems than Grace? Show your work. Dear Student If You Face any issue let me know i will solve your all doubt. I will provide solution again in more detail systematic and organized way. I would also like my last 3 questions credited to mearrow_forward
- Dalia buys 20 collectible gems per month. Grace sells 10 gems from her collection of 120 each month. When will Dalia have more gems than Grace? Show your work.arrow_forwardSolve the following system of equations. Show all work and solutions.y = 2x2 + 6x + 1y = −4x2 + 1arrow_forwardSolve the following systems of equations and show all work.y = x2 + 3y = x + 5arrow_forward
- Write an equation for the function shown. You may assume all intercepts and asymptotes are on integers. The blue dashed lines are the asymptotes. 10 9- 8- 7 6 5 4- 3- 2 4 5 15-14-13-12-11-10 -9 -8 -7 -6 -5 -4 -3 -2 1 1 2 3 -1 -2 -3 -4 1 -5 -6- -7 -8- -9 -10+ 60 7 8 9 10 11 12 13 14 15arrow_forwardUse the graph of the polynomial function of degree 5 to identify zeros and multiplicity. Order your zeros from least to greatest. -6 3 6+ 5 4 3 2 1 2 -1 -2 -3 -4 -5 3 4 6 Zero at with multiplicity Zero at with multiplicity Zero at with multiplicityarrow_forwardUse the graph to identify zeros and multiplicity. Order your zeros from least to greatest. 6 5 4 -6-5-4-3-2 3 21 2 1 2 4 5 ૪ 345 Zero at with multiplicity Zero at with multiplicity Zero at with multiplicity Zero at with multiplicity པ་arrow_forward
- Use the graph to write the formula for a polynomial function of least degree. -5 + 4 3 ♡ 2 12 1 f(x) -1 -1 f(x) 2 3. + -3 12 -5+ + xarrow_forwardUse the graph to identify zeros and multiplicity. Order your zeros from least to greatest. 6 -6-5-4-3-2-1 -1 -2 3 -4 4 5 6 a Zero at with multiplicity Zero at with multiplicity Zero at with multiplicity Zero at with multiplicityarrow_forwardUse the graph to write the formula for a polynomial function of least degree. 5 4 3 -5 -x 1 f(x) -5 -4 -1 1 2 3 4 -1 -2 -3 -4 -5 f(x) =arrow_forward
 Algebra and Trigonometry (6th Edition)AlgebraISBN:9780134463216Author:Robert F. BlitzerPublisher:PEARSON
 Contemporary Abstract AlgebraAlgebraISBN:9781305657960Author:Joseph GallianPublisher:Cengage Learning
 Linear Algebra: A Modern IntroductionAlgebraISBN:9781285463247Author:David PoolePublisher:Cengage Learning
 Algebra And Trigonometry (11th Edition)AlgebraISBN:9780135163078Author:Michael SullivanPublisher:PEARSON
 Introduction to Linear Algebra, Fifth EditionAlgebraISBN:9780980232776Author:Gilbert StrangPublisher:Wellesley-Cambridge Press
 College Algebra (Collegiate Math)AlgebraISBN:9780077836344Author:Julie Miller, Donna GerkenPublisher:McGraw-Hill Education