
MATH IN OUR WORLD:ALEKS>CUSTOM<
4th Edition
ISBN: 9781260499544
Author: sobecki
Publisher: MCG CUSTOM
expand_more
expand_more
format_list_bulleted
Videos
Textbook Question
Chapter 13, Problem 7RE
Use the graph shown in Figure 14-62 for Exercises 1–8.
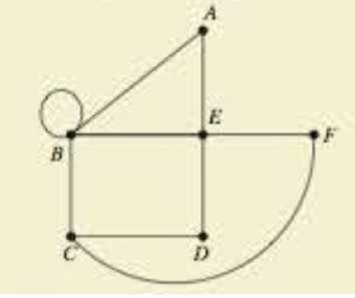
7. Is the graph connected?
Expert Solution & Answer
Want to see the full answer?
Check out a sample textbook solution
Students have asked these similar questions
Let n = 7, let p = 23 and let S be the set of least positive residues mod p of the first (p-1)/2
multiple of n, i.e.
n mod p, 2n mod p, ...,
2
p-1
-n mod p.
Let T be the subset of S consisting of those residues which exceed p/2.
Find the set T, and hence compute the Legendre symbol (7|23).
The first 11 multiples of 7 reduced mod 23 are
7, 14, 21, 5, 12, 19, 3, 10, 17, 1, 8.
23
The set T is the subset of these residues exceeding
2°
So T = {12, 14, 17, 19, 21}.
By Gauss' lemma (Apostol Theorem 9.6),
(7|23) = (−1)|T| = (−1)5 = −1.
how come?
Shading a Venn diagram with 3 sets: Unions, intersections, and...
The Venn diagram shows sets A, B, C, and the universal set U.
Shade (CUA)' n B on the Venn diagram.
U
Explanation
Check
A-
B
Q Search
田
3. A different 7-Eleven has a bank of slurpee fountain heads. Their available flavors are as follows: Mountain
Dew, Mountain Dew Code Red, Grape, Pepsi and Mountain Dew Livewire. You fill five different cups full
with each type of flavor. How many different ways can you arrange the cups in a line if exactly two Mountain
Dew flavors are next to each other?
3.2.1
Chapter 13 Solutions
MATH IN OUR WORLD:ALEKS>CUSTOM<
Ch. 13.1 - Prob. 1TTOCh. 13.1 - The floor plan shown in Figure 14-7 is for a...Ch. 13.1 - Prob. 3TTOCh. 13.1 - Draw a graph for my neighborhood, shown in Figure...Ch. 13.1 - Prob. 5TTOCh. 13.1 - Prob. 6TTOCh. 13.1 - Prob. 7TTOCh. 13.1 - Prob. 8TTOCh. 13.1 - Prob. 1ECh. 13.1 - What is the difference between a loop and a...
Ch. 13.1 - What is the difference between a circuit and a...Ch. 13.1 - Draw two graphs that look physically different but...Ch. 13.1 - Prob. 5ECh. 13.1 - Prob. 8ECh. 13.1 - Prob. 9ECh. 13.1 - Prob. 10ECh. 13.1 - Prob. 11ECh. 13.1 - How does graph coloring apply to maps?Ch. 13.1 - Use the following graph to answer Exercises 1324....Ch. 13.1 - Use the following graph to answer Exercises 1324....Ch. 13.1 - Use the following graph to answer Exercises 1324....Ch. 13.1 - Use the following graph to answer Exercises 1324....Ch. 13.1 - Use the following graph to answer Exercises 1324....Ch. 13.1 - Prob. 18ECh. 13.1 - Use the following graph to answer Exercises 1324....Ch. 13.1 - Prob. 20ECh. 13.1 - Use the following graph to answer Exercises 1324....Ch. 13.1 - Use the following graph to answer Exercises 1324....Ch. 13.1 - Use the following graph to answer Exercises 1324....Ch. 13.1 - Use the following graph to answer Exercises 1324....Ch. 13.1 - Prob. 25ECh. 13.1 - Prob. 26ECh. 13.1 - Prob. 27ECh. 13.1 - Prob. 28ECh. 13.1 - Prob. 29ECh. 13.1 - Prob. 30ECh. 13.1 - For Exercises 3134, represent each figure using a...Ch. 13.1 - Prob. 32ECh. 13.1 - Prob. 33ECh. 13.1 - Prob. 34ECh. 13.1 - Prob. 35ECh. 13.1 - Prob. 36ECh. 13.1 - For Exercises 3538, draw a graph to represent each...Ch. 13.1 - Prob. 38ECh. 13.1 - Prob. 39ECh. 13.1 - For Exercises 3942, draw a graph that represents...Ch. 13.1 - Prob. 41ECh. 13.1 - Prob. 42ECh. 13.1 - In Exercises 4350, use graph coloring to find the...Ch. 13.1 - Prob. 44ECh. 13.1 - Prob. 45ECh. 13.1 - Prob. 46ECh. 13.1 - In Exercises 4350, use graph coloring to find the...Ch. 13.1 - Prob. 48ECh. 13.1 - Prob. 49ECh. 13.1 - Prob. 50ECh. 13.1 - Prob. 51ECh. 13.1 - Prob. 52ECh. 13.1 - Prob. 53ECh. 13.1 - Prob. 54ECh. 13.1 - Prob. 55ECh. 13.1 - Draw a graph that represents the street map in...Ch. 13.1 - Prob. 57ECh. 13.1 - Prob. 58ECh. 13.1 - Prob. 59ECh. 13.1 - Prob. 61ECh. 13.1 - Prob. 62ECh. 13.1 - Prob. 63ECh. 13.1 - (a)When a graph represents a map as in Exercise...Ch. 13.2 - Classify the paths shown in the graphs as Euler...Ch. 13.2 - Use Euler's theorem to determine if the graphs...Ch. 13.2 - Prob. 3TTOCh. 13.2 - Prob. 4TTOCh. 13.2 - Prob. 1ECh. 13.2 - Prob. 2ECh. 13.2 - Prob. 3ECh. 13.2 - Prob. 4ECh. 13.2 - Prob. 5ECh. 13.2 - Prob. 6ECh. 13.2 - Prob. 7ECh. 13.2 - Prob. 8ECh. 13.2 - For Exercises 710, decide whether each connected...Ch. 13.2 - Prob. 10ECh. 13.2 - For Exercises 710, decide whether each connected...Ch. 13.2 - Prob. 12ECh. 13.2 - For Exercises 1120, (a)State whether the graph has...Ch. 13.2 - Prob. 14ECh. 13.2 - For Exercises 1120, (a)State whether the graph has...Ch. 13.2 - Prob. 16ECh. 13.2 - For Exercises 1120, (a)State whether the graph has...Ch. 13.2 - Prob. 18ECh. 13.2 - For Exercises 1120, (a)State whether the graph has...Ch. 13.2 - Prob. 20ECh. 13.2 - For Exercises 1120, (a)State whether the graph has...Ch. 13.2 - For Exercises 1120, (a)State whether the graph has...Ch. 13.2 - Prob. 23ECh. 13.2 - Prob. 24ECh. 13.2 - Prob. 25ECh. 13.2 - Prob. 26ECh. 13.2 - Prob. 27ECh. 13.2 - For Exercises 2126, draw a graph for the figures...Ch. 13.2 - Prob. 29ECh. 13.2 - Prob. 30ECh. 13.2 - Prob. 31ECh. 13.2 - Prob. 32ECh. 13.2 - Prob. 33ECh. 13.2 - Prob. 34ECh. 13.2 - For Exercises 33 and 34, determine if an Euler...Ch. 13.2 - For Exercises 33 and 34, determine if an Euler...Ch. 13.2 - Prob. 37ECh. 13.2 - Prob. 39ECh. 13.2 - Prob. 40ECh. 13.2 - Draw some sample graphs and use them to discuss...Ch. 13.2 - Prob. 42ECh. 13.2 - Prob. 43ECh. 13.2 - Prob. 44ECh. 13.2 - Prob. 45ECh. 13.2 - Explain why the word connected is crucial...Ch. 13.2 - Prob. 47ECh. 13.2 - Prob. 48ECh. 13.3 - Prob. 1TTOCh. 13.3 - Prob. 2TTOCh. 13.3 - Prob. 3TTOCh. 13.3 - The driving times in minutes between four cities...Ch. 13.3 - Prob. 5TTOCh. 13.3 - Prob. 6TTOCh. 13.3 - Prob. 7TTOCh. 13.3 - What is the difference between a Hamilton path and...Ch. 13.3 - Prob. 2ECh. 13.3 - Give an example of a problem in our world that can...Ch. 13.3 - Prob. 4ECh. 13.3 - Prob. 5ECh. 13.3 - Prob. 6ECh. 13.3 - Describe what a typical traveling salesperson...Ch. 13.3 - Prob. 8ECh. 13.3 - Prob. 9ECh. 13.3 - Prob. 10ECh. 13.3 - Prob. 11ECh. 13.3 - Prob. 12ECh. 13.3 - For Exercises 1118, find two different Hamilton...Ch. 13.3 - Prob. 14ECh. 13.3 - Prob. 15ECh. 13.3 - Prob. 16ECh. 13.3 - For Exercises 1118, find two different Hamilton...Ch. 13.3 - Prob. 18ECh. 13.3 - Prob. 19ECh. 13.3 - Prob. 20ECh. 13.3 - For Exercises 1118, find two different Hamilton...Ch. 13.3 - Prob. 22ECh. 13.3 - Prob. 23ECh. 13.3 - Prob. 24ECh. 13.3 - For Exercises 1924, find two different Hamilton...Ch. 13.3 - Prob. 26ECh. 13.3 - Prob. 27ECh. 13.3 - Prob. 28ECh. 13.3 - For Exercises 2528, find the number of Hamilton...Ch. 13.3 - Prob. 30ECh. 13.3 - Prob. 31ECh. 13.3 - For Exercises 29 and 30, use the brute force...Ch. 13.3 - For Exercises 3134, use the nearest neighbor...Ch. 13.3 - Prob. 34ECh. 13.3 - Prob. 35ECh. 13.3 - Prob. 36ECh. 13.3 - Prob. 37ECh. 13.3 - Prob. 38ECh. 13.3 - Prob. 39ECh. 13.3 - Prob. 40ECh. 13.3 - Prob. 41ECh. 13.3 - For Exercises 3942, use the information in the...Ch. 13.3 - Prob. 43ECh. 13.3 - Prob. 44ECh. 13.3 - Prob. 45ECh. 13.3 - For Exercises 4346, use the information in the...Ch. 13.3 - For Exercises 4346, use the information in the...Ch. 13.3 - For Exercises 45–48, use the information in the...Ch. 13.3 - Prob. 49ECh. 13.3 - A pizza delivery person has five prearranged...Ch. 13.3 - Prob. 51ECh. 13.3 - Prob. 52ECh. 13.3 - Prob. 53ECh. 13.3 - Prob. 54ECh. 13.3 - When planning routes, distance isnt always the key...Ch. 13.3 - Prob. 56ECh. 13.3 - Repeat questions 51 through 54, choosing four...Ch. 13.3 - Prob. 58ECh. 13.3 - Prob. 59ECh. 13.3 - Prob. 60ECh. 13.3 - Find a road atlas that has a mileage chart. Pick...Ch. 13.3 - Prob. 62ECh. 13.3 - Prob. 63ECh. 13.3 - Prob. 64ECh. 13.3 - Prob. 65ECh. 13.3 - Prob. 66ECh. 13.3 - Prob. 67ECh. 13.3 - Prob. 68ECh. 13.3 - Prob. 69ECh. 13.3 - Prob. 70ECh. 13.3 - Prob. 71ECh. 13.3 - Prob. 72ECh. 13.3 - Prob. 73ECh. 13.3 - Prob. 74ECh. 13.4 - Prob. 1TTOCh. 13.4 - Prob. 2TTOCh. 13.4 - Prob. 3TTOCh. 13.4 - Prob. 4TTOCh. 13.4 - Prob. 5TTOCh. 13.4 - Prob. 1ECh. 13.4 - Prob. 2ECh. 13.4 - Prob. 3ECh. 13.4 - Prob. 4ECh. 13.4 - Prob. 5ECh. 13.4 - Prob. 6ECh. 13.4 - For Exercise 716, decide whether or not each graph...Ch. 13.4 - Prob. 8ECh. 13.4 - Prob. 9ECh. 13.4 - Prob. 10ECh. 13.4 - Prob. 11ECh. 13.4 - Prob. 12ECh. 13.4 - Prob. 13ECh. 13.4 - Prob. 14ECh. 13.4 - Prob. 15ECh. 13.4 - Prob. 16ECh. 13.4 - Prob. 17ECh. 13.4 - Prob. 18ECh. 13.4 - Prob. 19ECh. 13.4 - Prob. 20ECh. 13.4 - Prob. 21ECh. 13.4 - Prob. 22ECh. 13.4 - Prob. 23ECh. 13.4 - Prob. 24ECh. 13.4 - Prob. 25ECh. 13.4 - Prob. 26ECh. 13.4 - Prob. 27ECh. 13.4 - Prob. 28ECh. 13.4 - Prob. 29ECh. 13.4 - Prob. 30ECh. 13.4 - Prob. 31ECh. 13.4 - Prob. 32ECh. 13.4 - Prob. 33ECh. 13.4 - As a new suburban neighborhood is being built, the...Ch. 13.4 - Prob. 35ECh. 13.4 - Prob. 36ECh. 13.4 - Prob. 37ECh. 13.4 - Prob. 38ECh. 13.4 - Prob. 39ECh. 13.4 - In the last two sections, we used both Hamilton...Ch. 13.4 - Prob. 41ECh. 13.4 - Prob. 42ECh. 13.4 - Prob. 43ECh. 13.4 - Prob. 44ECh. 13 - Use the graph shown in Figure 14-62 for Exercise...Ch. 13 - Prob. 2RECh. 13 - Prob. 3RECh. 13 - Prob. 4RECh. 13 - Prob. 5RECh. 13 - Prob. 6RECh. 13 - Use the graph shown in Figure 14-62 for Exercises...Ch. 13 - Prob. 8RECh. 13 - Prob. 9RECh. 13 - Prob. 10RECh. 13 - Prob. 11RECh. 13 - Prob. 12RECh. 13 - Prob. 13RECh. 13 - Repeat Exercise 13 for the graphs from Exercises...Ch. 13 - Prob. 15RECh. 13 - Prob. 16RECh. 13 - Prob. 17RECh. 13 - Prob. 18RECh. 13 - Prob. 19RECh. 13 - Prob. 20RECh. 13 - Prob. 21RECh. 13 - Prob. 22RECh. 13 - Prob. 23RECh. 13 - Prob. 24RECh. 13 - Prob. 25RECh. 13 - Prob. 26RECh. 13 - Prob. 27RECh. 13 - Prob. 28RECh. 13 - Prob. 29RECh. 13 - Prob. 30RECh. 13 - Prob. 31RECh. 13 - Prob. 32RECh. 13 - Prob. 33RECh. 13 - Prob. 34RECh. 13 - For the following graph: (a)What is the degree of...Ch. 13 - Draw a graph with two bridges, and the...Ch. 13 - Prob. 3CTCh. 13 - Prob. 4CTCh. 13 - (a)For the graph shown in Figure 14-73, find an...Ch. 13 - Prob. 6CTCh. 13 - For the housing plan shown in Figure 14-75, draw a...Ch. 13 - Prob. 8CTCh. 13 - Use the brute force method to find the shortest...Ch. 13 - Use the nearest neighbor method and cheapest link...Ch. 13 - Prob. 11CTCh. 13 - Decide whether the problem can be solved using...
Knowledge Booster


Learn more about
Need a deep-dive on the concept behind this application? Look no further. Learn more about this topic, subject and related others by exploring similar questions and additional content below.Similar questions
- Find all solutions of the polynomial congruence x²+4x+1 = 0 (mod 143). (The solutions of the congruence x² + 4x+1=0 (mod 11) are x = 3,4 (mod 11) and the solutions of the congruence x² +4x+1 = 0 (mod 13) are x = 2,7 (mod 13).)arrow_forwardhttps://www.hawkeslearning.com/Statistics/dbs2/datasets.htmlarrow_forwardDetermine whether each function is an injection and determine whether each is a surjection.The notation Z_(n) refers to the set {0,1,2,...,n-1}. For example, Z_(4)={0,1,2,3}. f: Z_(6) -> Z_(6) defined by f(x)=x^(2)+4(mod6). g: Z_(5) -> Z_(5) defined by g(x)=x^(2)-11(mod5). h: Z*Z -> Z defined by h(x,y)=x+2y. j: R-{3} -> R defined by j(x)=(4x)/(x-3).arrow_forward
- Determine whether each function is an injection and determine whether each is a surjection.arrow_forwardLet A = {a, b, c, d}, B = {a,b,c}, and C = {s, t, u,v}. Draw an arrow diagram of a function for each of the following descriptions. If no such function exists, briefly explain why. (a) A function f : AC whose range is the set C. (b) A function g: BC whose range is the set C. (c) A function g: BC that is injective. (d) A function j : A → C that is not bijective.arrow_forwardLet f:R->R be defined by f(x)=x^(3)+5.(a) Determine if f is injective. why?(b) Determine if f is surjective. why?(c) Based upon (a) and (b), is f bijective? why?arrow_forward
arrow_back_ios
SEE MORE QUESTIONS
arrow_forward_ios
Recommended textbooks for you
 Algebra & Trigonometry with Analytic GeometryAlgebraISBN:9781133382119Author:SwokowskiPublisher:Cengage
 Elementary Geometry For College Students, 7eGeometryISBN:9781337614085Author:Alexander, Daniel C.; Koeberlein, Geralyn M.Publisher:Cengage,
Algebra & Trigonometry with Analytic Geometry
Algebra
ISBN:9781133382119
Author:Swokowski
Publisher:Cengage
Elementary Geometry For College Students, 7e
Geometry
ISBN:9781337614085
Author:Alexander, Daniel C.; Koeberlein, Geralyn M.
Publisher:Cengage,
2.1 Introduction to inequalities; Author: Oli Notes;https://www.youtube.com/watch?v=D6erN5YTlXE;License: Standard YouTube License, CC-BY
GCSE Maths - What are Inequalities? (Inequalities Part 1) #56; Author: Cognito;https://www.youtube.com/watch?v=e_tY6X5PwWw;License: Standard YouTube License, CC-BY
Introduction to Inequalities | Inequality Symbols | Testing Solutions for Inequalities; Author: Scam Squad Math;https://www.youtube.com/watch?v=paZSN7sV1R8;License: Standard YouTube License, CC-BY