Statistical Techniques in Business and Economics
16th Edition
ISBN: 9780077639723
Author: Lind
Publisher: Mcgraw-Hill Course Content Delivery
expand_more
expand_more
format_list_bulleted
Concept explainers
Textbook Question
Chapter 13, Problem 61CE
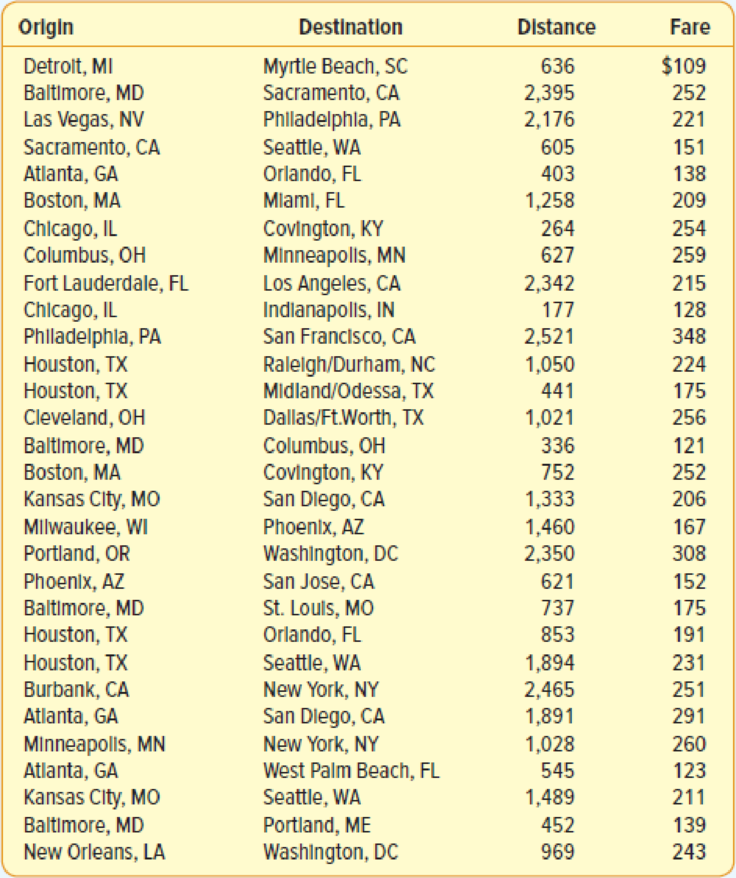
TravelAir.com samples domestic airline flights to explore the relationship between airfare and distance. The service would like to know if there is a

- a. Draw a
scatter diagram with Distance as the independent variable and Fare as the dependent variable. Is the relationship direct or indirect? - b. Compute the
correlation coefficient . At the .05 significance level, is it reasonable to conclude that the correlation coefficient is greater than zero? - c. What percentage of the variation in Fare is accounted for by Distance of a flight?
- d. Determine the regression equation. How much does each additional mile add to the fare? Estimate the fare for a 1,500-mile flight.
- e. A traveler is planning to fly from Atlanta to London Heathrow. The distance is 4,218 miles. She wants to use the regression equation to estimate the fare. Explain why it would not be a good idea to estimate the fare for this international flight with the regression equation.
Expert Solution & Answer
Trending nowThis is a popular solution!

Students have asked these similar questions
(c) Utilize Fubini's Theorem to demonstrate that
E(X)=
=
(1- F(x))dx.
(c) Describe the positive and negative parts of a random variable. How is the
integral defined for a general random variable using these components?
26. (a) Provide an example where X, X but E(X,) does not converge to E(X).
Chapter 13 Solutions
Statistical Techniques in Business and Economics
Ch. 13 - Prob. 1SRCh. 13 - Prob. 1ECh. 13 - Prob. 2ECh. 13 - Bi-lo Appliance Super-Store has outlets in several...Ch. 13 - Prob. 4ECh. 13 - Prob. 5ECh. 13 - The owner of Maumee Ford-Volvo wants to study the...Ch. 13 - Prob. 2SRCh. 13 - Prob. 7ECh. 13 - Prob. 8E
Ch. 13 - Prob. 9ECh. 13 - Prob. 10ECh. 13 - Prob. 11ECh. 13 - Prob. 12ECh. 13 - Prob. 3SRCh. 13 - Prob. 13ECh. 13 - Prob. 14ECh. 13 - Prob. 15ECh. 13 - Prob. 16ECh. 13 - Prob. 17ECh. 13 - Prob. 18ECh. 13 - Prob. 19ECh. 13 - Prob. 20ECh. 13 - Prob. 4SRCh. 13 - Prob. 21ECh. 13 - Prob. 22ECh. 13 - Prob. 23ECh. 13 - Prob. 24ECh. 13 - Prob. 5SRCh. 13 - Prob. 25ECh. 13 - Prob. 26ECh. 13 - Prob. 27ECh. 13 - Prob. 28ECh. 13 - Prob. 29ECh. 13 - Prob. 30ECh. 13 - Prob. 6SRCh. 13 - Prob. 31ECh. 13 - Prob. 32ECh. 13 - Prob. 33ECh. 13 - Refer to Exercise 16. a. Determine the .95...Ch. 13 - Prob. 35ECh. 13 - A regional commuter airline selected a random...Ch. 13 - Prob. 38CECh. 13 - Prob. 39CECh. 13 - Prob. 40CECh. 13 - The table below shows the number of cars (in...Ch. 13 - Prob. 42CECh. 13 - Prob. 43CECh. 13 - Prob. 44CECh. 13 - The manufacturer of Cardio Glide exercise...Ch. 13 - Prob. 46CECh. 13 - Prob. 47CECh. 13 - Prob. 48CECh. 13 - Prob. 49CECh. 13 - Mr. William Profit is studying companies going...Ch. 13 - Prob. 51CECh. 13 - Prob. 52CECh. 13 - Prob. 53CECh. 13 - Prob. 54CECh. 13 - A regression analysis relating the current market...Ch. 13 - Prob. 56CECh. 13 - Prob. 57CECh. 13 - A consumer buying cooperative tested the effective...Ch. 13 - Prob. 59CECh. 13 - Prob. 60CECh. 13 - TravelAir.com samples domestic airline flights to...Ch. 13 - Prob. 62DECh. 13 - Refer to the Baseball 2012 data, which reports...Ch. 13 - Prob. 64DE
Knowledge Booster
Learn more about
Need a deep-dive on the concept behind this application? Look no further. Learn more about this topic, statistics and related others by exploring similar questions and additional content below.Similar questions
- (b) Demonstrate that if X and Y are independent, then it follows that E(XY) E(X)E(Y);arrow_forward(d) Under what conditions do we say that a random variable X is integrable, specifically when (i) X is a non-negative random variable and (ii) when X is a general random variable?arrow_forward29. State the Borel-Cantelli Lemmas without proof. What is the primary distinction between Lemma 1 and Lemma 2?arrow_forward
- The masses measured on a population of 100 animals were grouped in the following table, after being recorded to the nearest gram Mass 89 90-109 110-129 130-149 150-169 170-189 > 190 Frequency 3 7 34 43 10 2 1 You are given that the sample mean of the data is 131.5 and the sample standard deviation is 20.0. Test the hypothesis that the distribution of masses follows a normal distribution at the 5% significance level.arrow_forwardstate without proof the uniqueness theorm of probability functionarrow_forward(a+b) R2L 2+2*0=? Ma state without proof the uniqueness theorm of probability function suppose thatPandQ are probability measures defined on the same probability space (Q, F)and that Fis generated by a π-system if P(A)=Q(A) tax for all A EthenP=Q i. e. P(A)=Q(A) for alla g // معدلة 2:23 صarrow_forward
arrow_back_ios
SEE MORE QUESTIONS
arrow_forward_ios
Recommended textbooks for you
 Glencoe Algebra 1, Student Edition, 9780079039897...AlgebraISBN:9780079039897Author:CarterPublisher:McGraw Hill
 Holt Mcdougal Larson Pre-algebra: Student Edition...AlgebraISBN:9780547587776Author:HOLT MCDOUGALPublisher:HOLT MCDOUGAL
 Big Ideas Math A Bridge To Success Algebra 1: Stu...AlgebraISBN:9781680331141Author:HOUGHTON MIFFLIN HARCOURTPublisher:Houghton Mifflin Harcourt
 Functions and Change: A Modeling Approach to Coll...AlgebraISBN:9781337111348Author:Bruce Crauder, Benny Evans, Alan NoellPublisher:Cengage Learning

Glencoe Algebra 1, Student Edition, 9780079039897...
Algebra
ISBN:9780079039897
Author:Carter
Publisher:McGraw Hill

Holt Mcdougal Larson Pre-algebra: Student Edition...
Algebra
ISBN:9780547587776
Author:HOLT MCDOUGAL
Publisher:HOLT MCDOUGAL

Big Ideas Math A Bridge To Success Algebra 1: Stu...
Algebra
ISBN:9781680331141
Author:HOUGHTON MIFFLIN HARCOURT
Publisher:Houghton Mifflin Harcourt

Functions and Change: A Modeling Approach to Coll...
Algebra
ISBN:9781337111348
Author:Bruce Crauder, Benny Evans, Alan Noell
Publisher:Cengage Learning
Correlation Vs Regression: Difference Between them with definition & Comparison Chart; Author: Key Differences;https://www.youtube.com/watch?v=Ou2QGSJVd0U;License: Standard YouTube License, CC-BY
Correlation and Regression: Concepts with Illustrative examples; Author: LEARN & APPLY : Lean and Six Sigma;https://www.youtube.com/watch?v=xTpHD5WLuoA;License: Standard YouTube License, CC-BY