Statistical Techniques in Business and Economics
18th Edition
ISBN: 9781260579611
Author: Douglas Lind; William Marchal; Samuel Wathen
Publisher: MCGRAW-HILL HIGHER EDUCATION
expand_more
expand_more
format_list_bulleted
Concept explainers
Textbook Question
Chapter 13, Problem 50CE
Mr. William Profit is studying companies going public for the first time. He is particularly interested in the relationship between the size of the offering and the price per share. A sample of 15 companies that recently went public revealed the following information.
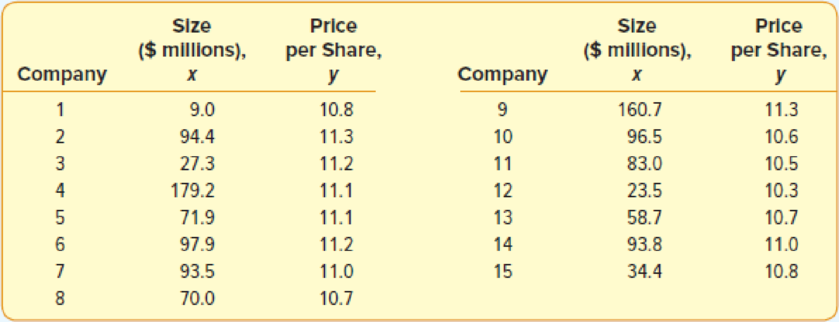
- a. Determine the regression equation.
- b. Conduct a test to determine whether the slope of the regression line is positive.
- c. Determine the coefficient of determination. Do you think Mr. Profit should be satisfied with using the size of the offering as the independent variable?
Expert Solution & Answer
Want to see the full answer?
Check out a sample textbook solutionStudents have asked these similar questions
A. Write the equation of the regression line.
B. Interpret the slope in this context, and calculate the predicted birth weight of first borns and others
C. Is there a statistically significant relationship between the average birth weight and parity? Provide an explanation with numeric support.
The Transactional Records Access Clearinghouse at Syracuse University reported data showing the odds of an Internal Revenue Service audit. The following table shows the average adjusted gross income reported and the percent of the returns that were audited for 20 selected IRS districts.
Develop the estimated regression equation that could be used to predict the percent audited given the average adjusted gross income reported.
At the .05 level of significance, determine whether the adjusted gross income and the percent audited are related.
Did the estimated regression equation provide a good fit?
District
Adjusted Gross Income ($)
Percent Audited
Los Angeles
36,664
1.3
Sacramento
38,845
1.1
Atlanta
34,886
1.1
Boise
32,512
1.1
Dallas
34,531
1.0
Providence
35,995
1.0
San Jose
37,799
0.9
Cheyenne
33,876
0.9
Fargo
30,513
0.9
New Orleans
30,174
0.9
Oklahoma City
30,060
0.8
Houston
37,153…
Consider the following passage:
I ran a regression, with many variables to predict the result of another variable which was the murder rate. One can see that lots of things, can cause the murder rate to increase or decrease. I tried to account for all the important factors, and those factors are the SAT scores, unemployment rate, and international migration per 1,000. The SAT score is, average combined total score participants did on the SAT exam. The unemployment rate is, "a measure of the prevalence of unemployment and it is calculated as a percentage by dividing the number of unemployed individuals by all individuals currently in the labor force." (Wikipedia) International migration per 1,000 is, the number of people who come into a state from other countries per 1,000 people who live in the state. After I run the regression I will look at the t scores and p values and I should hopefully conclude that international migration does not cause crime.
Which writing mistakes, if any, did…
Chapter 13 Solutions
Statistical Techniques in Business and Economics
Ch. 13 - Prob. 1SRCh. 13 - Prob. 1ECh. 13 - Prob. 2ECh. 13 - Bi-lo Appliance Super-Store has outlets in several...Ch. 13 - Prob. 4ECh. 13 - Prob. 5ECh. 13 - The owner of Maumee Ford-Volvo wants to study the...Ch. 13 - Prob. 2SRCh. 13 - Prob. 7ECh. 13 - Prob. 8E
Ch. 13 - Prob. 9ECh. 13 - Prob. 10ECh. 13 - Prob. 11ECh. 13 - Prob. 12ECh. 13 - Prob. 3SRCh. 13 - Prob. 13ECh. 13 - Prob. 14ECh. 13 - Prob. 15ECh. 13 - Prob. 16ECh. 13 - Prob. 17ECh. 13 - Prob. 18ECh. 13 - Prob. 19ECh. 13 - Prob. 20ECh. 13 - Prob. 4SRCh. 13 - Prob. 21ECh. 13 - Prob. 22ECh. 13 - Prob. 23ECh. 13 - Prob. 24ECh. 13 - Prob. 5SRCh. 13 - Prob. 25ECh. 13 - Prob. 26ECh. 13 - Prob. 27ECh. 13 - Prob. 28ECh. 13 - Prob. 29ECh. 13 - Prob. 30ECh. 13 - Prob. 6SRCh. 13 - Prob. 31ECh. 13 - Prob. 32ECh. 13 - Prob. 33ECh. 13 - Refer to Exercise 16. a. Determine the .95...Ch. 13 - Prob. 35ECh. 13 - A regional commuter airline selected a random...Ch. 13 - Prob. 38CECh. 13 - Prob. 39CECh. 13 - Prob. 40CECh. 13 - Prob. 41CECh. 13 - Prob. 42CECh. 13 - Prob. 43CECh. 13 - Prob. 44CECh. 13 - The manufacturer of Cardio Glide exercise...Ch. 13 - Prob. 46CECh. 13 - Prob. 47CECh. 13 - Prob. 48CECh. 13 - Prob. 49CECh. 13 - Mr. William Profit is studying companies going...Ch. 13 - Prob. 51CECh. 13 - Prob. 54CECh. 13 - A regression analysis relating the current market...Ch. 13 - Prob. 56CECh. 13 - Prob. 57CECh. 13 - Prob. 58CECh. 13 - Prob. 59CECh. 13 - Prob. 60CECh. 13 - TravelAir.com samples domestic airline flights to...Ch. 13 - The North Valley Real Estate data reports...Ch. 13 - Prob. 64DA
Knowledge Booster
Learn more about
Need a deep-dive on the concept behind this application? Look no further. Learn more about this topic, statistics and related others by exploring similar questions and additional content below.Similar questions
- Find the equation of the regression line for the following data set. x 1 2 3 y 0 3 4arrow_forwardLife Expectancy The following table shows the average life expectancy, in years, of a child born in the given year42 Life expectancy 2005 77.6 2007 78.1 2009 78.5 2011 78.7 2013 78.8 a. Find the equation of the regression line, and explain the meaning of its slope. b. Plot the data points and the regression line. c. Explain in practical terms the meaning of the slope of the regression line. d. Based on the trend of the regression line, what do you predict as the life expectancy of a child born in 2019? e. Based on the trend of the regression line, what do you predict as the life expectancy of a child born in 1580?2300arrow_forwardXYZ Corporation Stock Prices The following table shows the average stock price, in dollars, of XYZ Corporation in the given month. Month Stock price January 2011 43.71 February 2011 44.22 March 2011 44.44 April 2011 45.17 May 2011 45.97 a. Find the equation of the regression line. Round the regression coefficients to three decimal places. b. Plot the data points and the regression line. c. Explain in practical terms the meaning of the slope of the regression line. d. Based on the trend of the regression line, what do you predict the stock price to be in January 2012? January 2013?arrow_forward
- For the following exercises, consider the data in Table 5, which shows the percent of unemployed in a city ofpeople25 years or older who are college graduates is given below, by year. 41. Based on the set of data given in Table 7, calculatethe regression line using a calculator or othertechnology tool, and determine the correlationcoefficient to three decimal places.arrow_forwardFor the following exercises, use Table 4 which shows the percent of unemployed persons 25 years or older who are college graduates in a particular city, by year. Based on the set of data given in Table 5, calculate the regression line using a calculator or other technology tool, and determine the correlation coefficient. Round to three decimal places of accuracyarrow_forwardDemand for Candy Bars In this problem you will determine a linear demand equation that describes the demand for candy bars in your class. Survey your classmates to determine what price they would be willing to pay for a candy bar. Your survey form might look like the sample to the left. a Make a table of the number of respondents who answered yes at each price level. b Make a scatter plot of your data. c Find and graph the regression line y=mp+b, which gives the number of respondents y who would buy a candy bar if the price were p cents. This is the demand equation. Why is the slope m negative? d What is the p-intercept of the demand equation? What does this intercept tell you about pricing candy bars? Would you buy a candy bar from the vending machine in the hallway if the price is as indicated. Price Yes or No 50 75 1.00 1.25 1.50 1.75 2.00arrow_forward
- For the following exercises, consider the data in Table 5, which shows the percent of unemployed ina city of people 25 years or older who are college graduates is given below, by year. 40. Based on the set of data given in Table 6, calculate the regression line using a calculator or other technology tool, and determine the correlation coefficient to three decimal places.arrow_forwardOlympic Pole Vault The graph in Figure 7 indicates that in recent years the winning Olympic men’s pole vault height has fallen below the value predicted by the regression line in Example 2. This might have occurred because when the pole vault was a new event there was much room for improvement in vaulters’ performances, whereas now even the best training can produce only incremental advances. Let’s see whether concentrating on more recent results gives a better predictor of future records. (a) Use the data in Table 2 (page 176) to complete the table of winning pole vault heights shown in the margin. (Note that we are using x=0 to correspond to the year 1972, where this restricted data set begins.) (b) Find the regression line for the data in part ‚(a). (c) Plot the data and the regression line on the same axes. Does the regression line seem to provide a good model for the data? (d) What does the regression line predict as the winning pole vault height for the 2012 Olympics? Compare this predicted value to the actual 2012 winning height of 5.97 m, as described on page 177. Has this new regression line provided a better prediction than the line in Example 2?arrow_forwardConsider the following passage: I ran a regression, with many variables to predict the result of another variable which was the murder rate. One can see that lots of things, can cause the murder rate to increase or decrease. I tried to account for all the important factors, and those factors are the SAT scores, unemployment rate, and international migration per 1,000. The SAT score is, average combined total score participants did on the SAT exam. The unemployment rate is, "a measure of the prevalence of unemployment and it is calculated as a percentage by dividing the number of unemployed individuals by all individuals currently in the labor force." (Wikipedia) International migration per 1,000 is, the number of people who come into a state from other countries per 1,000 people who live in the state. After I run the regression I will look at the t scores and p values and I should hopefully conclude that international migration does not cause crime. Which writing mistakes, if any, did…arrow_forward
- You have been hired to help a large supermarket retail chain. they are trying to understand how aisle location of specialty pet food - whether specialty pet food is placed at the front or back of the aisle, and shelf space allocated to it (in square feet) affect its sales. An data analyst colleague provided the following regression analysis. Sales: weekly sales in $ (dependent variable) aisle location: 1 if the product was placed at the front of the aisle; 0 if the product was placed at the back of the aisle Shelf space: shelf space occupied by specialty pet food (in square feet) Use the attached regression analysis to answer the following questions: Question A. If two stores A and B had the same shelf space allocated to specialty pet food but store A placed this product at the front of the aisle whereas store B placed this product at the back of the aisle, which of these two stores would have higher sales of this specialty pet food? A or B? Question B Suppose that you have…arrow_forwardMark Price, the new productions manager for Speakers and Company, needs to find out which variable most affects the demand for their line of company speakers. He is uncertain whether the unit price of the product or the effects of increased marketing are the main drivers in sales and wants to use regression analysis to figure out which factor drives more demand for its particular market. Pertinent information was collected by an extensive marketing project that lasted over the past 12 years and was reduced to the data that follow: YEAR 1 2 3 4 5 6 7 B 9 10 11 12 UNIT SALES (THOUSANDS) 398 698 898 y bar 1,304 1,163 1,195 898 1,200 982 1,235 875 811 PRICE $ PER UNIT 283 209 213 220 209 200 220 209 230 213 216 243 ADVERTISING ($000) 621 821 1,200 1,405 1,210 1,304 875 1,200 691 875 691 691 a. Perform a regression analysis based on these data using Excel. Note: Negative values should be indicated by a minus sign. Round your answers to 4 decimal places. Price advertisingarrow_forwardRestaurant Digest, a famous restaurant magazine writes that the amount of tips servers get in Florida is affected by several factors including the amount of bill, number of adult diners as well as kids and the income of the diners. Use the data below to answer the following questions: Find the multiple regression model. At a level of significance of 0.03, is there a significance relationship between the amount of tip and at least one of the independent variables? What is the likely amount of tip if a group of diners spend $40.33 and had an annual income of $81,000. The diners included 4 adults and 3 kids? What percent of the variation in amount of tip is accounted for by amount of bill, annual income, number of adults and kids? Customer Amount of Tip Amount of Bill Number of adult Diners Number of kids Annual Income 1 $ 7.00 $ 48.97 5 3 100000 2 $ 4.50 $ 28.23 4 3 80000 3…arrow_forward
arrow_back_ios
SEE MORE QUESTIONS
arrow_forward_ios
Recommended textbooks for you
- Glencoe Algebra 1, Student Edition, 9780079039897...AlgebraISBN:9780079039897Author:CarterPublisher:McGraw HillAlgebra and Trigonometry (MindTap Course List)AlgebraISBN:9781305071742Author:James Stewart, Lothar Redlin, Saleem WatsonPublisher:Cengage Learning
- Functions and Change: A Modeling Approach to Coll...AlgebraISBN:9781337111348Author:Bruce Crauder, Benny Evans, Alan NoellPublisher:Cengage LearningCollege AlgebraAlgebraISBN:9781305115545Author:James Stewart, Lothar Redlin, Saleem WatsonPublisher:Cengage LearningBig Ideas Math A Bridge To Success Algebra 1: Stu...AlgebraISBN:9781680331141Author:HOUGHTON MIFFLIN HARCOURTPublisher:Houghton Mifflin Harcourt
Glencoe Algebra 1, Student Edition, 9780079039897...
Algebra
ISBN:9780079039897
Author:Carter
Publisher:McGraw Hill
Algebra and Trigonometry (MindTap Course List)
Algebra
ISBN:9781305071742
Author:James Stewart, Lothar Redlin, Saleem Watson
Publisher:Cengage Learning
Functions and Change: A Modeling Approach to Coll...
Algebra
ISBN:9781337111348
Author:Bruce Crauder, Benny Evans, Alan Noell
Publisher:Cengage Learning
College Algebra
Algebra
ISBN:9781305115545
Author:James Stewart, Lothar Redlin, Saleem Watson
Publisher:Cengage Learning
Big Ideas Math A Bridge To Success Algebra 1: Stu...
Algebra
ISBN:9781680331141
Author:HOUGHTON MIFFLIN HARCOURT
Publisher:Houghton Mifflin Harcourt
Correlation Vs Regression: Difference Between them with definition & Comparison Chart; Author: Key Differences;https://www.youtube.com/watch?v=Ou2QGSJVd0U;License: Standard YouTube License, CC-BY
Correlation and Regression: Concepts with Illustrative examples; Author: LEARN & APPLY : Lean and Six Sigma;https://www.youtube.com/watch?v=xTpHD5WLuoA;License: Standard YouTube License, CC-BY