In a completely randomized experimental design, three brands of paper towels were tested for their ability to absorb water. Equal-size towels were used, with four sections of towels tested per brand. The absorbency rating data follow. At a .05 level of significance, does there appear to be a difference in the ability of the brands to absorb water?
| Brand | ||
| x | y | z |
| 91 | 99 | 83 |
| 100 | 96 | 88 |
| 88 | 94 | 89 |
| 89 | 99 | 76 |
Check whether there is a significant difference among the mean absorbency ratings for the three brands at
Answer to Problem 34SE
Yes, there appear to be a difference in the ability of the brands to absorb water.
Explanation of Solution
Calculation:
The data represents the absorbency rate for the three brands.
State the hypotheses:
Null hypothesis:
Alternative hypothesis:
The level of significance is 0.05.
Software procedure:
Step by step procedure to obtain One-Way ANOVA using the MINITAB software:
- Choose Stat > ANOVA > One-Way.
- In Response, enter the column of values.
- In Factor, enter the column of Brands.
- Click OK.
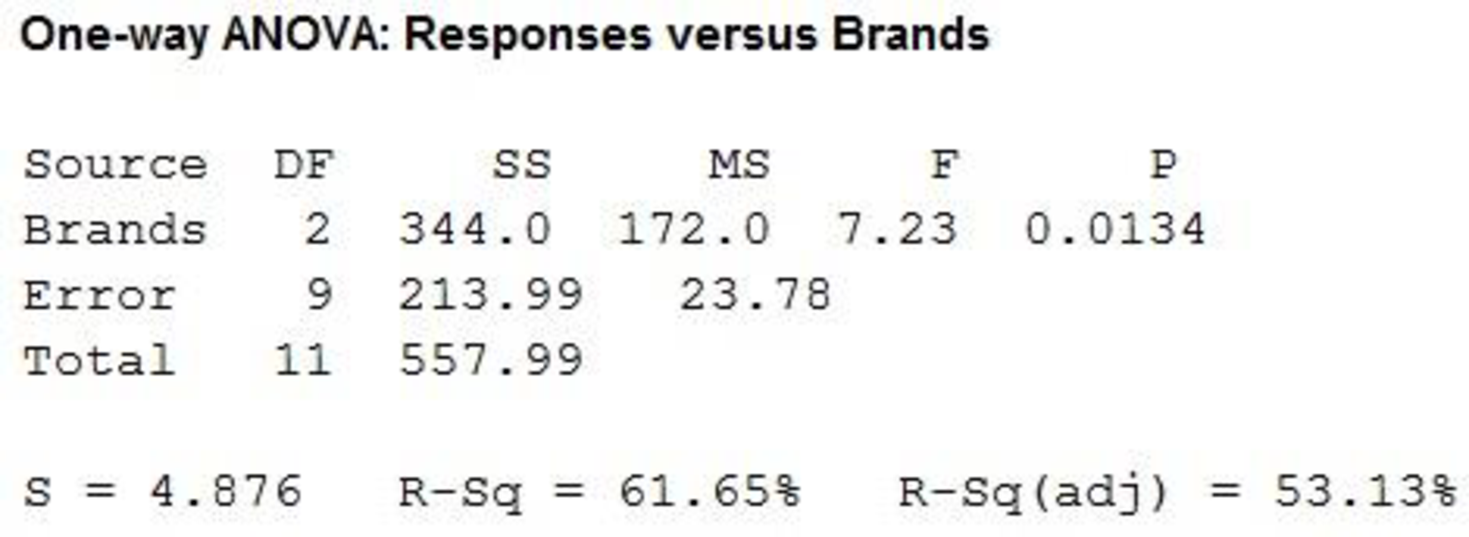
Output using the MINITAB software is given below:

From the Minitab output the F-ratio is 7.23 and the p-value is 0.0134.
Decision:
If
If
Conclusion:
Here, the p-value is less than the level of significance.
That is,
Therefore, the null hypothesis is rejected.
Hence, there is sufficient evidence to infer that there is a significant difference among the mean absorbency ratings for the three brands at
Want to see more full solutions like this?
Chapter 13 Solutions
Statistics for Business & Economics (with XLSTAT Education Edition Printed Access Card) (MindTap Course List)
- AP1.1 You look at real estate ads for houses in Sarasota, Florida. Many houses range from $200,000 to $400,000 in price. The few houses on the water, however, have prices up to $15 million. Which of the following statements best describes the distribution of home prices in Sarasota? The distribution is most likely skewed to the left, and the mean is greater than the median. The distribution is most likely skewed to the left, and the mean is less than the median. The distribution is roughly symmetric with a few high outliers, and the mean is approximately equal to the median. The distribution is most likely skewed to the right, and the mean is greater than the median. The distribution is most likely skewed to the right, and the mean is less than the median.arrow_forwardDuring busy political seasons, many opinion polls are conducted. In apresidential race, how do you think the participants in polls are generally selected?Discuss any issues regarding simple random, stratified, systematic, cluster, andconvenience sampling in these polls. What about other types of polls, besides political?arrow_forwardPlease could you explain why 0.5 was added to each upper limpit of the intervals.Thanksarrow_forward
- 28. (a) Under what conditions do we say that two random variables X and Y are independent? (b) Demonstrate that if X and Y are independent, then it follows that E(XY) = E(X)E(Y); (e) Show by a counter example that the converse of (ii) is not necessarily true.arrow_forward1. Let X and Y be random variables and suppose that A = F. Prove that Z XI(A)+YI(A) is a random variable.arrow_forward30. (a) What is meant by the term "product measur"? ANDarrow_forward
 Glencoe Algebra 1, Student Edition, 9780079039897...AlgebraISBN:9780079039897Author:CarterPublisher:McGraw Hill
 Big Ideas Math A Bridge To Success Algebra 1: Stu...AlgebraISBN:9781680331141Author:HOUGHTON MIFFLIN HARCOURTPublisher:Houghton Mifflin Harcourt
 Holt Mcdougal Larson Pre-algebra: Student Edition...AlgebraISBN:9780547587776Author:HOLT MCDOUGALPublisher:HOLT MCDOUGAL


