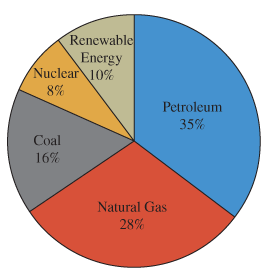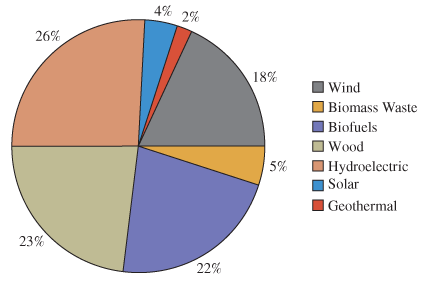
Questions 1-5 use the pie charts below. The first illustrates the percentage of energy consumption in the United States by energy source for 2014. The second illustrates the specific breakdown of different renewable energy sources.
U.S. Energy Consumption by Source

Breakdown of Renewable Energy Sources

The first chart shows that 35% of our energy came from petroleum. The total energy usage for the United States in 2014 was 98.3 quadrillion BTU (British thermal units). What does the result of the calculation
Want to see the full answer?
Check out a sample textbook solution
Chapter 1 Solutions
Pathways to Math Literacy
Additional Math Textbook Solutions
Pathways To Math Literacy (looseleaf)
College Algebra (Collegiate Math)
Elementary Statistics ( 3rd International Edition ) Isbn:9781260092561
Intermediate Algebra (13th Edition)
APPLIED STAT.IN BUS.+ECONOMICS
University Calculus: Early Transcendentals (4th Edition)
- Rylee's car is stuck in the mud. Roman and Shanice come along in a truck to help pull her out. They attach one end of a tow strap to the front of the car and the other end to the truck's trailer hitch, and the truck starts to pull. Meanwhile, Roman and Shanice get behind the car and push. The truck generates a horizontal force of 377 lb on the car. Roman and Shanice are pushing at a slight upward angle and generate a force of 119 lb on the car. These forces can be represented by vectors, as shown in the figure below. The angle between these vectors is 20.2°. Find the resultant force (the vector sum), then give its magnitude and its direction angle from the positive x-axis. 119 lb 20.2° 377 lb a. The resultant force is (Tip: omit degree notations from your answers; e.g. enter cos(45) instead of cos(45°)) b. It's magnitude is lb. c. It's angle from the positive x-axis isarrow_forwardComplete the table below. For solutions, round to the nearest whole number.arrow_forwardA biologist is investigating the effect of potential plant hormones by treating 20 stem segments. At the end of the observation period he computes the following length averages: Compound X = 1.18 Compound Y = 1.17 Based on these mean values he concludes that there are no treatment differences. 1) Are you satisfied with his conclusion? Why or why not? 2) If he asked you for help in analyzing these data, what statistical method would you suggest that he use to come to a meaningful conclusion about his data and why? 3) Are there any other questions you would ask him regarding his experiment, data collection, and analysis methods?arrow_forward
- Businessarrow_forwardAnswer first questionarrow_forwardLet the universal set be whole numbers 1 through 20 inclusive. That is, U = {1, 2, 3, 4, . . ., 19, 20}. Let A, B, and C be subsets of U. Let A be the set of all prime numbers: A = {2, 3, 5, 7, 11, 13, 17, 19} Let B be the set of all odd numbers: B = {1,3,5,7, . . ., 17, 19} Let C be the set of all square numbers: C = {1,4,9,16}arrow_forward
- A research team consists of 4 senior researchers and 10 research assistants. The team needs to select 2 senior researchers and 2 research assistants to attend a conference. How many different ways can the group being sent to the conference be formed?arrow_forwardThere are 25 different varieties of flowering plants found in a natural habitat you are studying. You are asked to randomly select 5 of these flowering plant varieties to bring back to your laboratory for further study. How many different combinations of are possible? That is, how many possible 5 plant subgroups can be formed out of the 25 total plants found?arrow_forwardA person is tossing a fair, two-sided coin three times and recording the results (either a Heads, H, or a Tails, T). Let E be the event that exactly two heads are tossed. Which of the following sets represent the event E? Group of answer choices {HHT, HTH, THH} {HHT, THH} {HHH, HHT, HTH, THH, TTT, TTH, THT, HTT} {HH}arrow_forward
- Take Quiz 54m Exit Let the universal set be whole numbers 1 through 20 inclusive. That is, U = {1, 2, 3, 4, . . ., 19, 20}. Let A, B, and C be subsets of U. Let A be the set of all prime numbers: A = {2, 3, 5, 7, 11, 13, 17, 19} Let B be the set of all odd numbers: B = {1,3,5,7, • • , 17, 19} Let C be the set of all square numbers: C = {1,4,9,16} ☐ Question 2 3 pts Which of the following statement(s) is true? Select all that apply. (1) АСВ (2) A and C are disjoint (mutually exclusive) sets. (3) |B| = n(B) = 10 (4) All of the elements in AC are even numbers. ☐ Statement 1 is true. Statement 2 is true. Statement 3 is true. Statement 4 is true.arrow_forward☐ Question 1 2 pts Let G be the set that represents all whole numbers between 5 and 12 exclusive. Which of the following is set G in standard set notation. (Roster Method)? O G = [5, 12] G = {5, 6, 7, 8, 9, 10, 11, 12} O G = (5, 12) OG = {6, 7, 8, 9, 10, 11}arrow_forwardSolve 11.23arrow_forward
 Functions and Change: A Modeling Approach to Coll...AlgebraISBN:9781337111348Author:Bruce Crauder, Benny Evans, Alan NoellPublisher:Cengage Learning
 Holt Mcdougal Larson Pre-algebra: Student Edition...AlgebraISBN:9780547587776Author:HOLT MCDOUGALPublisher:HOLT MCDOUGAL
 Algebra: Structure And Method, Book 1AlgebraISBN:9780395977224Author:Richard G. Brown, Mary P. Dolciani, Robert H. Sorgenfrey, William L. ColePublisher:McDougal Littell
 Mathematics For Machine TechnologyAdvanced MathISBN:9781337798310Author:Peterson, John.Publisher:Cengage Learning,Algebra & Trigonometry with Analytic GeometryAlgebraISBN:9781133382119Author:SwokowskiPublisher:Cengage
 College AlgebraAlgebraISBN:9781305115545Author:James Stewart, Lothar Redlin, Saleem WatsonPublisher:Cengage Learning


