
Videos
Juvenile Delinquents Dr. Kirkland R. Gable (in Schwitzgebel 1964) studied 20 male juvenile delinquents who had each spent 6 months or more in a Massachusetts juvenile detention center. He wondered whether simply asking the juvenile delinquents to talk would help them stay out of jail in the future. The subjects were paid to talk into a tape recorder about anything they wanted for one hour, 3 to 5 days a week for 6 months; there was no therapist present. A control group was formed by matching each subject in the experimental group with a juvenile delinquent who was the same age, had the same ethnic background, grew up in the same town, had committed the same types of offenses, and had spent the same amount of time incarcerated. The control group received no treatment. The experimental and control groups were followed for three years.
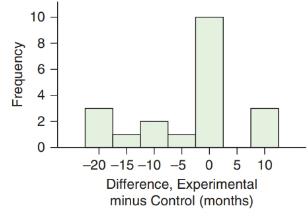
The data are available at the website for the number of months of incarceration in the 3-year period following the 6-month-long experiment. The histogram shows the differences for the entire data set: experimental minus control. A negative difference means a subject in the experimental group spent less time in jail than did his control (which is the outcome the researcher is hoping for). Although these subjects were not a random sample, we can test to see whether the difference is too large to attribute to chance if we assume the matched subjects in the control group were chosen at random.
a. Summarize the months of incarceration for both groups in one or two sentences. Include appropriate numerical summaries.
b. Perform a sign test to determine whether the typical amount of jail time after the experiment was less for the treatment group than for the control group. Use a significance level of 0.05.
Want to see the full answer?
Check out a sample textbook solution
Chapter 13 Solutions
Introductory Statistics
Additional Math Textbook Solutions
College Algebra (Collegiate Math)
Elementary Statistics ( 3rd International Edition ) Isbn:9781260092561
Intermediate Algebra (13th Edition)
APPLIED STAT.IN BUS.+ECONOMICS
Algebra and Trigonometry (6th Edition)
University Calculus: Early Transcendentals (4th Edition)


- A marketing agency wants to determine whether different advertising platforms generate significantly different levels of customer engagement. The agency measures the average number of daily clicks on ads for three platforms: Social Media, Search Engines, and Email Campaigns. The agency collects data on daily clicks for each platform over a 10-day period and wants to test whether there is a statistically significant difference in the mean number of daily clicks among these platforms. Conduct ANOVA test. You can provide your answer by inserting a text box and the answer must include: also please provide a step by on getting the answers in excel Null hypothesis, Alternative hypothesis, Show answer (output table/summary table), and Conclusion based on the P value.arrow_forwardA company found that the daily sales revenue of its flagship product follows a normal distribution with a mean of $4500 and a standard deviation of $450. The company defines a "high-sales day" that is, any day with sales exceeding $4800. please provide a step by step on how to get the answers Q: What percentage of days can the company expect to have "high-sales days" or sales greater than $4800? Q: What is the sales revenue threshold for the bottom 10% of days? (please note that 10% refers to the probability/area under bell curve towards the lower tail of bell curve) Provide answers in the yellow cellsarrow_forwardBusiness Discussarrow_forward
- The following data represent total ventilation measured in liters of air per minute per square meter of body area for two independent (and randomly chosen) samples. Analyze these data using the appropriate non-parametric hypothesis testarrow_forwardeach column represents before & after measurements on the same individual. Analyze with the appropriate non-parametric hypothesis test for a paired design.arrow_forwardShould you be confident in applying your regression equation to estimate the heart rate of a python at 35°C? Why or why not?arrow_forward
 Holt Mcdougal Larson Pre-algebra: Student Edition...AlgebraISBN:9780547587776Author:HOLT MCDOUGALPublisher:HOLT MCDOUGAL