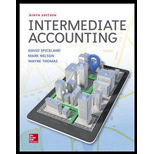
INTERMEDIATE ACCOUNTING (LL) W/CONNECT
9th Edition
ISBN: 9781260679694
Author: SPICELAND
Publisher: MCG
expand_more
expand_more
format_list_bulleted
Question
Chapter 13, Problem 13.16BYP
(1)
To determine
Financial Ratios: Financial ratios are the metrics used to evaluate the liquidity, capabilities, profitability, and overall performance of a company.
To calculate:
2.
To determine
To calculate: Acid-test ratio for Company I for 2018.
Expert Solution & Answer
Want to see the full answer?
Check out a sample textbook solutionStudents have asked these similar questions
Company Comparison
Tesla
GM
Ford
Toyota
Current Ratio
1.24
1.07
1.16
1.04
Total asset
0.77
0.60
0.60
0.59
turnover ratio
Debt ratio
0.80
0.81
1.92
4.83
Gross profit
16.55%
10.18%
13.60%
10.01%
margin
P/E ratio
N/A
8.15
N/A
7.81
The company with the best debt ratio, P/E ratio, and total asset turnover ratio is:
Select one:
O a. GM
O b. Ford
○ c. Toyota
O d. Tesla
Problem 19-4 Per-Share Ratios (LO3, CFA6)
You are given the following information for Smashville, Incorporated.
Cost of goods sold:
Investment income:
Net sales:
Operating expense:
Interest expense:
Dividends:
Tax rate:
Current liabilities:
Cash:
Long-term debt:
$ 200,000
$ 2,700
$ 333,000
$ 47,000
$ 7,400
$ 16,000
21%
$ 26,000
$ 21,000
$ 21,000
Other assets:
$ 43,000
$ 159,000
Other liabilities:
$ 5,000
Fixed assets:
Investments:
Operating assets:
$ 47,000
$ 39,000
During the year, Smashville, Incorporated, had 20,000 shares of stock outstanding and depreciation expense of $15,000. Calculate the
book value per share, earnings per share, and cash flow per share.
Note: Do not round intermediate calculations. Round your answers to 2 decimal places.
Book value per share
Earnings per share
Cash flow per share
$
12.85
Sh3
Chapter 13 Solutions
INTERMEDIATE ACCOUNTING (LL) W/CONNECT
Ch. 13 - What are the essential characteristics of...Ch. 13 - Prob. 13.2QCh. 13 - Bronson Distributors owes a supplier 100,000 on...Ch. 13 - Bank loans often are arranged under existing lines...Ch. 13 - Prob. 13.5QCh. 13 - Prob. 13.6QCh. 13 - Salaries of 5,000 have been earned by employees by...Ch. 13 - Prob. 13.8QCh. 13 - Prob. 13.9QCh. 13 - Prob. 13.10Q
Ch. 13 - Prob. 13.11QCh. 13 - Prob. 13.12QCh. 13 - Long-term obligations usually are reclassified and...Ch. 13 - How do IFRS and U.S. GAAP differ with respect to...Ch. 13 - Prob. 13.15QCh. 13 - Prob. 13.16QCh. 13 - Prob. 13.17QCh. 13 - Prob. 13.18QCh. 13 - Suppose the analysis of a loss contingency...Ch. 13 - Prob. 13.20QCh. 13 - Distinguish between the accounting treatment of a...Ch. 13 - At December 31, the end of the reporting period,...Ch. 13 - After the end of the reporting period, a...Ch. 13 - Prob. 13.24QCh. 13 - Prob. 13.25QCh. 13 - Prob. 13.26QCh. 13 - Prob. 13.27QCh. 13 - Prob. 13.28QCh. 13 - Bank loan; accrued interest LO132 On October 1,...Ch. 13 - Non-interest-bearing note; accrued interest LO132...Ch. 13 - Determining accrued interest LO132 On July1,...Ch. 13 - Commercial paper LO132 Branch Corporation issued...Ch. 13 - Non-interest-bearing note; effective interest rate...Ch. 13 - Prob. 13.6BECh. 13 - Advance collection LO133 In Lizzie Shoes...Ch. 13 - Sales tax LO133 DuringDecember, Rainey Equipment...Ch. 13 - Classifying debt LO134 Consider the following...Ch. 13 - Prob. 13.10BECh. 13 - Prob. 13.11BECh. 13 - Prob. 13.12BECh. 13 - Prob. 13.13BECh. 13 - Contingency LO135, LO136 Skill Hardware is the...Ch. 13 - Contingency LO135, LO136 Bell International can...Ch. 13 - Prob. 13.16BECh. 13 - Prob. 13.17BECh. 13 - Unasserted assessment LO135, LO136 At March 13,...Ch. 13 - Bank loan; accrued interest LO132 On November 1,...Ch. 13 - Determining accrued interest in various situations...Ch. 13 - Short-term notes LO132 The following selected...Ch. 13 - Paid future absences LO133 JWS Transport Companys...Ch. 13 - Paid future absences LO133 On January 1, 2018,...Ch. 13 - Prob. 13.6ECh. 13 - Customer deposits LO133 Diversified...Ch. 13 - Prob. 13.8ECh. 13 - Prob. 13.9ECh. 13 - FASB codification research LO133, LO134, LO135...Ch. 13 - Current noncurrent classification of debt; Sprint...Ch. 13 - Prob. 13.12ECh. 13 - Current noncurrent classification of debt LO131,...Ch. 13 - Prob. 13.14ECh. 13 - Warranties LO135, LO136 Cupola Awning Corporation...Ch. 13 - Extended warranties LO135, LO136 Carnes...Ch. 13 - Prob. 13.17ECh. 13 - Impairment of accounts receivable LO135, LO136...Ch. 13 - Prob. 13.19ECh. 13 - Various transactions involving contingencies ...Ch. 13 - Prob. 13.21ECh. 13 - Prob. 13.22ECh. 13 - Disclosures of liabilities Indicate (by letter)...Ch. 13 - Warranty expense; change in estimate LO135, LO136...Ch. 13 - Change in accounting estimate LO133 The...Ch. 13 - Contingency; Dow Chemical Company disclosure ...Ch. 13 - Payroll-related liabilities Appendix Lee...Ch. 13 - Prob. 13.1PCh. 13 - Prob. 13.2PCh. 13 - Current noncurrent classification of debt LO131,...Ch. 13 - Various liabilities LO131 through LO134 The...Ch. 13 - Bonus compensation; algebra LO133 Sometimes...Ch. 13 - Various contingencies LO135, LO136 Eastern...Ch. 13 - Prob. 13.7PCh. 13 - Expected cash flow approach; product recall LO136...Ch. 13 - Subsequent events LO136 Lincoln Chemicals became...Ch. 13 - Subsequent events; classification of debt; loss...Ch. 13 - Prob. 13.11PCh. 13 - Various liabilities; balance sheet classification;...Ch. 13 - Payroll-related liabilities Appendix Alamar...Ch. 13 - Prob. 13.1BYPCh. 13 - Prob. 13.3BYPCh. 13 - Prob. 13.4BYPCh. 13 - Prob. 13.5BYPCh. 13 - Prob. 13.7BYPCh. 13 - Prob. 13.8BYPCh. 13 - Judgment Case 139 Loss contingency and full...Ch. 13 - Prob. 13.10BYPCh. 13 - Prob. 13.12BYPCh. 13 - Prob. 13.13BYPCh. 13 - Prob. 13.14BYPCh. 13 - Prob. 13.15BYPCh. 13 - Prob. 13.16BYPCh. 13 - Prob. 13.18BYPCh. 13 - Real World Case 1319 Contingencies LO135 Real...Ch. 13 - Real World Case 1320 Contingencies and Subsequent...Ch. 13 - Prob. 1CCTCCh. 13 - Prob. 1CCIFRS
Knowledge Booster
Similar questions
- 5arrow_forwardModule 6 Question 3arrow_forwardINSTRUCTIONS Section 1- Financial Analysis FSA Company's Summary Financial Data (In billions, except per share data) 2020 2019 2018 2017 2016 Net Sales 30.20 29.70 29.10 29.40 28.50 Gross Profit 16.10 17.30 17.20 16.80 16.60 Operating Income Net Income 12.50 12.90 12.10 12.70 12.80 11.90 0.90 12.80 11.60 11.80 1.70 11.80 Restructuring charge (after tax) Net Income before restructuring Op Income before restructuring 1.30 1.00 0.50 L10 12.80 12.90 1390 12.90 12.20 13.80 13.90 13.00 13.20 17.80 20.90 14.40 13 50 5.00 Total Assets 21.00 19.00 18.30 Total Liabilities 15.00 13.80 12.60 Long Term Debt Shareholder Equity Treasury Stock at cost 6.60 6.00 6.00 5.20 5.40 6.50 5.70 5.50 5.20 4.00 3.50 6. 10 5.30 5.20 29 32 28.54 28 29 28.04 Basic Earnings per share. Cash Dividends per share 29.00 14.50 14.20 14.00 13.60 13.00 53.00 Closing Stock Price Shares Outstatiding (billions) 75.00 63.00 64.00 69.00 0.40 0.41 0.42 0,41 0 42 Using the above information, kindly prepare the following: a)…arrow_forward
- financial management ch 17 hw I worked out part a, but not sure what I did wrong. Please show work and explain, thank you. Question 5arrow_forwardBrief Exercise 12-65Profitability Ratios Tinker Corporation operates in the highly competitive consulting industry. Tinker's balance sheet indicates the following balances as of December 31, 2019. Cash $80,000 Accounts receivable 87,000 Inventory 52,000 Property, plant, and equipment 485,000 Accounts payable 73,000 Bonds payable (due in 2021) 110,000 Common stock (12/31/2018) 250,000 Common stock (12/31/2019) 275,000 Retained earnings (12/31/2018) 180,000 Retained earnings (12/31/2019) 220,000 Required: Calculate Tinker's return on equity if Tinker's 2019 net income is $90,000. Round your answer to two decimal places. %arrow_forwardIAS 29 Financial Reporting in Hyperinflationary Economies Q. Here is Finished Ltd.'s year-end statement of financial position as at December 31, 2016, which is the first year the economy has been hyperinflationary. Use the figures provided to complete the sentence below. Cash: 6 Debtors: 200 Share capital: 300 (contributed on January 1, 2014) 100 Price Indices January 1, 2014 920 January 1, 2016 1,340 December 31, 2016 1,920 Average 2016 1,520 At December 31, 2016, cash was disclosed at an amount of The statement of financial position will show a balance of share capital. for debtors and for Fill in the boxes by dragging and dropping the correct options from below and then select Submit. ` A B 100 126.32 200 252.63 286.57 378.95 626.09 143.28 429.85 Submitarrow_forward
- xercise 12-80Asset Efficiency Ratios Financial statements for Steele Inc. follow. Steele Inc. Consolidated Income Statements (in thousands except per share amounts) 2019 2018 2017 Net sales $7,245,088 $6,944,296 $6,149,218 Cost of goods sold (5,286,253) (4,953,556) (4,355,675) Gross margin $1,958,835 $1,990,740 $1,793,543 General and administrative expenses (1,259,896) (1,202,042) (1,080,843) Special and nonrecurring items 2,617 0 0 Operating income $701,556 $788,698 $712,700 Interest expense (63,685) (62,398) (63,927) Other income 7,308 10,080 11,529 Gain on sale of investments 0 9,117 0 Income before income taxes $645,179 $745,497 $660,302 Provision for income taxes (254,000) (290,000) (257,000) Net income $391,179 $455,497 $403,302 Steele Inc. Consolidated Balance Sheets (in thousands) ASSETS Dec. 31, 2019 Dec. 31, 2018 Current assets: Cash and equivalents…arrow_forwardProblem 11-11 (Algo) Review problem—understanding liquidity measures LO 1 Assume that the current ratio for Arch Company is 2.5, its acid-test ratio is 1.5, and its working capital is $390,000. Answer each of the following questions independently,always referring to the original information.Required: How much does the firm have in current liabilities? (Do not round intermediate calculations.) If the only current assets shown on the balance sheet for Arch Company are Cash, Accounts Receivable, and Merchandise Inventory, how much does the firm have in Merchandise Inventory? (Do not round intermediate calculations.) If the firm collects an account receivable of $117,000, what will its new current ratio and working capital be? (Round "Current ratio" to 1 decimal place.) If the firm pays an account payable of $53,000, what will its new current ratio and working capital be? (Do not round intermediate calculations. Round "Current ratio" to 1 decimal place.) If the firm sells inventory that…arrow_forwardQUESTION 8 As of 2021, banks in the U.S. had an average ratio of equity to assets ratio of a. 10% b. 20% c.25% d.5%arrow_forward
- Nineteen measures of solvency and profitability The comparative financial statements of Stargel Inc. are as follows. The market price of Stargel Inc. common stock was 119.70 on December 31, 2016. Stargel Inc. Comparative Retained Earnings Statement For the Years Ended December 31, 2016 and 2015 2016 2015 Retained earnings, January 1................ 5,375,000 4,545,000 Add net income for year......................... 900,000 925,000 Total..................................... 6,275,000 5,470,000 Deduct dividends: On preferred stock............................................. 45,000 45,000 On common stock.............................................. 50,000 50,000 Total........................................................ 95,0000 95,000 Retained earnings, December 3................................... 6,180,000 5,375,000 Stargel Inc. Comparative Income Statement For the Year Ended December 31, 2016 and 2015 2016 2015 Sales..................... 10,000,000 9,400,000 Cost of goods sold......... 5,350,000 4,950,000 Gross profit............... 4,650,000 4,450,000 Selling expenses.......... 2,000,000 1,080,000 Administrative expenses... 1,500.000 1,410,000 Total operating expenses 3,500,000 3,290,000 Income from operations ... 1,150,000 1,160,000 Other income............. 150,000 140,000 1,300,000 1,300,000 Other expense (interest). 170,000 150,000 Income before income tax 1,130,000 1,150,000 Income tax expense....... 230,000 225,000 Net income............... 900,000 925,000 Stargel Inc. Comparative Income Statement For the Year Ended December 31, 2016 and 2015 Dec.31, 2016 Dec. 31, 2015 Assets Current Assets: Cash.................................... 500,000 400,000 Marketable securities.................... 1,010,000 1,000,000 Accounts receivable (net)................. 740,000 510,000 Inventories.............................. 1,190000 950,000 Prepaid expenses........................ 250,000 229,000 Total current assets..................... 3,690,000 3,089,000 Long-term investments.................... 2,350,000 2,300,000 Property, plant and equipment (net)....... 3,740,000 3,366,000 Total assets............................... 9,780,000 8,755,000 Liabilities Current liabilities.......................... 900,000 880,000 Long-term liabilities: Mortgage note payable, 8.8%, due 2021... 200,000 0 Bonds payable, 9%, due 2017............. 1,500,000 1,500,000 Total long term liabilities............... 1,700,000 1,500,000 Total liabilities............................ 2,600,000 2,380,000 Stockholders' equity Preferred stock 0.90, 10 par.. 500,000 500,000 Common stock. 5 par..................... 500,000 500,000 Retained earnings......................... 6,180,000 5,375,000 Total stockholders' equity............... 7,180,000 6,375,000 Total liabilities and stockholders' equity..... 9,780,000 8,755,000 Instructions Determine the following measures for 2016, rounding to one decimal place, except per share amounts, which should be rounded to the nearest penny: 1. Working capital 2. Current ratio 3. Quick ratio 4. Accounts receivable turnover 5. Number of days salts in receivables 6. Inventory turnover 7. Number of days sales in inventory 8. Ratio of fixed assets to long-term liabilities 9. Ratio of liabilities to .stockholders' equity 10. Number of times interest charges are earned 11. Number of times preferred dividends are earned 12. Ratio of sales to assets 13. Rate earned on total assets 14. Rate earned on stockholders' equity 15. Rate earned on common stockholders' equity 16. Earnings per share on common stock 17. Price-earnings ratio 18. Dividends per share of common stock 19. Dividend yieldarrow_forwardValue Chain Analysis and Financial Statement Relations. Exhibit 1.25 (page 68) presents common-size income statements and balance sheets for seven firms that operate at various stages in the value chain for the pharmaceutical industry. These common-size statements express all amounts as a percentage of sales revenue. Exhibit 1.25 also shows the cash flow from operations to capital expenditures ratios for each firm. A dash for a particular financial statement item does not necessarily mean the amount is zero. It merely indicates that the amount is not sufficiently large for the firm to disclose it. A list of the seven companies and a brief description of their activities follow. A. Wyeth: Engages in the development, manufacture, and sale of ethical drugs (that is, drugs requiring a prescription). Wyeths drugs represent primarily mixtures of chemical compounds. Ethical-drug companies must obtain approval of new drugs from the U.S. Food and Drug Administration (FDA). Patents protect such drugs from competition until other drug companies develop more effective substitutes or the patent expires. B. Amgen: Engages in the development, manufacture, and sale of drugs based on biotechnology research. Biotechnology drugs must obtain approval from the FDA and enjoy patent protection similar to that for chemical-based drugs. The biotechnology segment is less mature than the ethical-drug industry, with relatively few products having received FDA approval. C. Mylan Laboratories: Engages in the development, manufacture, and sale of generic drugs. Generic drugs have the same chemical compositions as drugs that had previously benefited from patent protection but for which the patent has expired. Generic-drug companies have benefited in recent years from the patent expiration of several major ethical drugs. However, the major ethical-drug companies have increasingly offered generic versions of their ethical drugs to compete against the generic-drug companies. D. Johnson Johnson: Engages in the development, manufacture, and sale of over-thecounter health care products. Such products do not require a prescription and often benefit from brand recognition. E. Covance: Offers product development and laboratory testing services for biotechnology and pharmaceutical drugs. It also offers commercialization services and market access services. Cost of goods sold for this company represents the salaries of personnel conducting the laboratory testing and drug approval services. F. Cardinal Health: Distributes drugs as a wholesaler to drugstores, hospitals, and mass erchandisers. Also offers pharmaceutical benefit management services in which it provides customized databases designed to help customers order more efficiently, contain costs, and monitor their purchases. Cost of goods sold for Cardinal Health includes the cost of drugs sold plus the salaries of personnel providing pharmaceutical benefit management services. G. Walgreens: Operates a chain of drugstores nationwide. The data in Exhibit 1.25 for Walgreens include the recognition of operating lease commitments for retail space. REQUIRED Use the ratios to match the companies in Exhibit 1.25 with the firms listed above.arrow_forwardReturn on assets ExxonMobil Corporation (XOM) explores, produces, and distributes oil and natural gas. The Coca-Cola Company (KO) produces and distributes soft drink beverages, including Coke. Wal-Mart Stores, Inc.., (WMT) operates retail stores and supermarkets. The following data (in millions) were taken from recent financial statements of each company: Compute the return on assets for each company using the preceding data, and rank the companies’ return on assets from highest to lowest. Round the return on assets to one decimal place.arrow_forward
arrow_back_ios
SEE MORE QUESTIONS
arrow_forward_ios
Recommended textbooks for you
- Survey of Accounting (Accounting I)AccountingISBN:9781305961883Author:Carl WarrenPublisher:Cengage LearningFundamentals of Financial Management, Concise Edi...FinanceISBN:9781285065137Author:Eugene F. Brigham, Joel F. HoustonPublisher:Cengage LearningFundamentals of Financial Management, Concise Edi...FinanceISBN:9781305635937Author:Eugene F. Brigham, Joel F. HoustonPublisher:Cengage Learning
- Corporate Financial AccountingAccountingISBN:9781305653535Author:Carl Warren, James M. Reeve, Jonathan DuchacPublisher:Cengage LearningCorporate Financial AccountingAccountingISBN:9781337398169Author:Carl Warren, Jeff JonesPublisher:Cengage Learning
Survey of Accounting (Accounting I)
Accounting
ISBN:9781305961883
Author:Carl Warren
Publisher:Cengage Learning
Fundamentals of Financial Management, Concise Edi...
Finance
ISBN:9781285065137
Author:Eugene F. Brigham, Joel F. Houston
Publisher:Cengage Learning
Fundamentals of Financial Management, Concise Edi...
Finance
ISBN:9781305635937
Author:Eugene F. Brigham, Joel F. Houston
Publisher:Cengage Learning
Corporate Financial Accounting
Accounting
ISBN:9781305653535
Author:Carl Warren, James M. Reeve, Jonathan Duchac
Publisher:Cengage Learning
Corporate Financial Accounting
Accounting
ISBN:9781337398169
Author:Carl Warren, Jeff Jones
Publisher:Cengage Learning