Superbowl Advertising Exercises 109 and 110 are based on the following graph and data showing the increasing cost of a 30-second television ad during the Super Bowl. 55 Year 1970 1980 1990 2000 2010 Cost ($1,000) 78 222 700 2,100 2,950 Take t to be the number of years since 1970 and y to be the cost, in thousands of dollars, of a Super Bowl ad. a. Model the 1970 and 1990 data with a linear equation. b. Model the 1990 and 2010 data with a linear equation. c. Use the results of parts (a) and (b) to obtain a piecewise-linear model of the cost of a Super Bowl ad during 1970-2010. d. Use your model to estimate the cost in 2004. Is your answer in rough agreement with the graph? Explain any discrepancy.
Superbowl Advertising Exercises 109 and 110 are based on the following graph and data showing the increasing cost of a 30-second television ad during the Super Bowl. 55 Year 1970 1980 1990 2000 2010 Cost ($1,000) 78 222 700 2,100 2,950 Take t to be the number of years since 1970 and y to be the cost, in thousands of dollars, of a Super Bowl ad. a. Model the 1970 and 1990 data with a linear equation. b. Model the 1990 and 2010 data with a linear equation. c. Use the results of parts (a) and (b) to obtain a piecewise-linear model of the cost of a Super Bowl ad during 1970-2010. d. Use your model to estimate the cost in 2004. Is your answer in rough agreement with the graph? Explain any discrepancy.
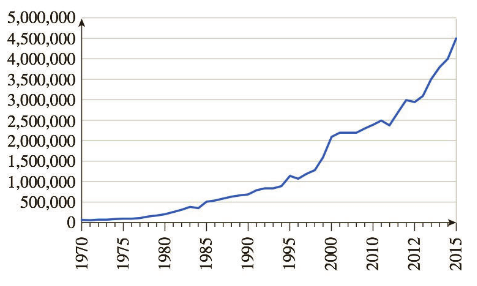
Superbowl AdvertisingExercises 109 and 110 are based on the following graph and data showing the increasing cost of a 30-second television ad during the Super Bowl.55
Year
1970
1980
1990
2000
2010
Cost ($1,000)
78
222
700
2,100
2,950
Take t to be the number of years since 1970 and y to be the cost, in thousands of dollars, of a Super Bowl ad.
a. Model the 1970 and 1990 data with a linear equation.
b. Model the 1990 and 2010 data with a linear equation.
c. Use the results of parts (a) and (b) to obtain a piecewise-linear model of the cost of a Super Bowl ad during 1970-2010.
d. Use your model to estimate the cost in 2004. Is your answer in rough agreement with the graph? Explain any discrepancy.
Can you answer this question and give step by step and why and how to get it. Can you write it (numerical method)
Can you answer this question and give step by step and why and how to get it. Can you write it (numerical method)
There are three options for investing $1150. The first earns 10% compounded annually, the second earns 10% compounded quarterly, and the third earns 10% compounded continuously. Find equations that model each investment growth and
use a graphing utility to graph each model in the same viewing window over a 20-year period. Use the graph to determine which investment yields the highest return after 20 years. What are the differences in earnings among the three
investment?
STEP 1: The formula for compound interest is
A =
nt
= P(1 + − − ) n²,
where n is the number of compoundings per year, t is the number of years, r is the interest rate, P is the principal, and A is the amount (balance) after t years. For continuous compounding, the formula reduces to
A = Pert
Find r and n for each model, and use these values to write A in terms of t for each case.
Annual Model
r=0.10
A = Y(t) = 1150 (1.10)*
n = 1
Quarterly Model
r = 0.10
n = 4
A = Q(t) = 1150(1.025) 4t
Continuous Model
r=0.10
A = C(t) =…
Need a deep-dive on the concept behind this application? Look no further. Learn more about this topic, calculus and related others by exploring similar questions and additional content below.
Linear Equation | Solving Linear Equations | What is Linear Equation in one variable ?; Author: Najam Academy;https://www.youtube.com/watch?v=tHm3X_Ta_iE;License: Standard YouTube License, CC-BY


 Trigonometry (MindTap Course List)TrigonometryISBN:9781337278461Author:Ron LarsonPublisher:Cengage Learning
 Glencoe Algebra 1, Student Edition, 9780079039897...AlgebraISBN:9780079039897Author:CarterPublisher:McGraw Hill
 College Algebra (MindTap Course List)AlgebraISBN:9781305652231Author:R. David Gustafson, Jeff HughesPublisher:Cengage Learning
 Algebra and Trigonometry (MindTap Course List)AlgebraISBN:9781305071742Author:James Stewart, Lothar Redlin, Saleem WatsonPublisher:Cengage Learning
 College AlgebraAlgebraISBN:9781305115545Author:James Stewart, Lothar Redlin, Saleem WatsonPublisher:Cengage Learning