EBK ORGANIC CHEMISTRY
9th Edition
ISBN: 8220100591310
Author: McMurry
Publisher: CENGAGE L
expand_more
expand_more
format_list_bulleted
Concept explainers
Videos
Textbook Question
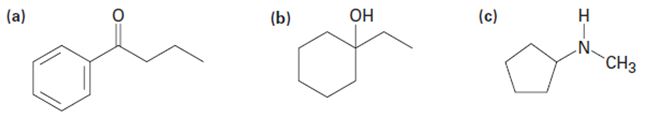
Chapter 12.SE, Problem 26AP
What fragments might you expect in the mass spectra of the following compounds?
Expert Solution & Answer

Trending nowThis is a popular solution!

Students have asked these similar questions
Chemistry Question
Draw the formula of the product obtained by reacting adipic acid 1st with PCl5 and 2nd treatment with NH3.
please help me with my homework
Chapter 12 Solutions
EBK ORGANIC CHEMISTRY
Ch. 12.2 - Prob. 1PCh. 12.2 - Two mass spectra are shown in FIGURE 12-8. One...Ch. 12.3 - What are the masses of the charged fragments...Ch. 12.3 - Prob. 4PCh. 12.5 - Prob. 5PCh. 12.5 - Prob. 6PCh. 12.7 - What functional groups might the following...Ch. 12.7 - How might you use IR spectroscopy to distinguish...Ch. 12.8 - Prob. 9PCh. 12.8 - Where might the following compounds have IR...
Ch. 12.8 - Where might the following compound have IR...Ch. 12.SE - Prob. 12VCCh. 12.SE - Show the structures of the fragments you would...Ch. 12.SE - Propose structures for compounds that fit the...Ch. 12.SE - Write molecular formulas for compounds that show...Ch. 12.SE - Camphor, a saturated monoketone from the Asian...Ch. 12.SE - The nitrogen rule of mass spectrometry says that a...Ch. 12.SE - In light of the nitrogen rule mentioned in Problem...Ch. 12.SE - Nicotine is a diamino compound isolated from dried...Ch. 12.SE - The hormone cortisone contains C, H, and O, and...Ch. 12.SE - Halogenated compounds are particularly easy to...Ch. 12.SE - Prob. 22APCh. 12.SE - Propose structures for compounds that fit the...Ch. 12.SE - 2-Methylpentane (C6H14) has the mass spectrum...Ch. 12.SE - Assume that you are in a laboratory carrying out...Ch. 12.SE - What fragments might you expect in the mass...Ch. 12.SE - How might you use IR spectroscopy to distinguish...Ch. 12.SE - Would you expect two enantiomers such as...Ch. 12.SE - Would you expect two diastereomers such as meso-2,...Ch. 12.SE - Propose structures for compounds that meet the...Ch. 12.SE - How could you use infrared spectroscopy to...Ch. 12.SE - Prob. 32APCh. 12.SE - At what approximate positions might the following...Ch. 12.SE - How would you use infrared spectroscopy to...Ch. 12.SE - At what approximate positions might the following...Ch. 12.SE - Assume that you are carrying out the dehydration...Ch. 12.SE - Assume that you are carrying out the base-induced...Ch. 12.SE - Prob. 38APCh. 12.SE - Carvone is an unsaturated ketone responsible for...Ch. 12.SE - Prob. 40APCh. 12.SE - The mass spectrum (a) and the infrared spectrum...Ch. 12.SE - The mass spectrum (a) and the infrared spectrum...Ch. 12.SE - Propose structures for compounds that meet the...Ch. 12.SE - 4-Methyl-2-pentanone and 3-methylpentanal are...Ch. 12.SE - Grignard reagents undergo a general and very...Ch. 12.SE - Ketones undergo a reduction when treated with...Ch. 12.SE - Nitriles, R–=C≡N, undergo a hydrolysis...Ch. 12.SE - The infrared spectrum of the compound with the...Ch. 12.SE - The infrared spectrum of the compound with the...Ch. 12.SE - Prob. 50AP
Knowledge Booster


Learn more about
Need a deep-dive on the concept behind this application? Look no further. Learn more about this topic, chemistry and related others by exploring similar questions and additional content below.Similar questions
- helparrow_forwardThe temperature on a sample of pure X held at 1.25 atm and -54. °C is increased until the sample boils. The temperature is then held constant and the pressure is decreased by 0.42 atm. On the phase diagram below draw a path that shows this set of changes. pressure (atm) 2 0 0 200 400 temperature (K) Xarrow_forwardQUESTION: Answer Question 5: 'Calculating standard error of regression' STEP 1 by filling in all the empty green boxes *The values are all provided in the photo attached*arrow_forward
- pressure (atm) 3 The pressure on a sample of pure X held at 47. °C and 0.88 atm is increased until the sample condenses. The pressure is then held constant and the temperature is decreased by 82. °C. On the phase diagram below draw a path that shows this set of changes. 0 0 200 temperature (K) 400 аarrow_forwarder your payment details | bar xb Home | bartleby x + aleksogi/x/isl.exe/1o u-lgNskr7j8P3jH-1Qs_pBanHhviTCeeBZbufuBYT0Hz7m7D3ZcW81NC1d8Kzb4srFik1OUFhKMUXzhGpw7k1 O States of Matter Sketching a described thermodynamic change on a phase diagram 0/5 The pressure on a sample of pure X held at 47. °C and 0.88 atm is increased until the sample condenses. The pressure is then held constant and the temperature is decreased by 82. °C. On the phase diagram below draw a path that shows this set of changes. pressure (atm) 1 3- 0- 0 200 Explanation Check temperature (K) 400 X Q Search L G 2025 McGraw Hill LLC. All Rights Reserved Terms of Use Privacy Cearrow_forward5.arrow_forward
- 6.arrow_forward0/5 alekscgi/x/sl.exe/1o_u-IgNglkr7j8P3jH-IQs_pBaHhvlTCeeBZbufuBYTi0Hz7m7D3ZcSLEFovsXaorzoFtUs | AbtAURtkqzol 1HRAS286, O States of Matter Sketching a described thermodynamic change on a phase diagram The pressure on a sample of pure X held at 47. °C and 0.88 atm is increased until the sample condenses. The pressure is then held constant and the temperature is decreased by 82. °C. On the phase diagram below draw a path that shows this set of changes. 3 pressure (atm) + 0- 0 5+ 200 temperature (K) 400 Explanation Check X 0+ F3 F4 F5 F6 F7 S 2025 McGraw Hill LLC All Rights Reserved. Terms of Use Privacy Center Accessibility Q Search LUCR + F8 F9 F10 F11 F12 * % & ( 5 6 7 8 9 Y'S Dele Insert PrtSc + Backsarrow_forward5.arrow_forward
- 9arrow_forwardalekscgi/x/lsl.exe/1o_u-IgNslkr7j8P3jH-IQs_pBanHhvlTCeeBZbufu BYTI0Hz7m7D3ZS18w-nDB10538ZsAtmorZoFusYj2Xu9b78gZo- O States of Matter Sketching a described thermodynamic change on a phase diagram 0/5 The pressure on a sample of pure X held at 47. °C and 0.88 atm is increased until the sample condenses. The pressure is then held constant and the temperature is decreased by 82. °C. On the phase diagram below draw a path that shows this set of changes. pressure (atm) 3- 200 temperature (K) Explanation Chick Q Sowncharrow_forward0+ aleksog/x/lsl.exe/1ou-lgNgkr7j8P3H-IQs pBaHhviTCeeBZbufuBYTOHz7m7D3ZStEPTBSB3u9bsp3Da pl19qomOXLhvWbH9wmXW5zm O States of Matter Sketching a described thermodynamic change on a phase diagram 0/5 Gab The temperature on a sample of pure X held at 0.75 atm and -229. °C is increased until the sample sublimes. The temperature is then held constant and the pressure is decreased by 0.50 atm. On the phase diagram below draw a path that shows this set of changes. F3 pressure (atm) 0- 0 200 Explanation temperature (K) Check F4 F5 ☀+ Q Search Chill Will an 9 ENG F6 F7 F8 F9 8 Delete F10 F11 F12 Insert PrtSc 114 d Ararrow_forward
arrow_back_ios
SEE MORE QUESTIONS
arrow_forward_ios
Recommended textbooks for you

 Organic Chemistry: A Guided InquiryChemistryISBN:9780618974122Author:Andrei StraumanisPublisher:Cengage Learning
 Organic ChemistryChemistryISBN:9781305580350Author:William H. Brown, Brent L. Iverson, Eric Anslyn, Christopher S. FootePublisher:Cengage Learning
Organic Chemistry: A Guided Inquiry
Chemistry
ISBN:9780618974122
Author:Andrei Straumanis
Publisher:Cengage Learning
Organic Chemistry
Chemistry
ISBN:9781305580350
Author:William H. Brown, Brent L. Iverson, Eric Anslyn, Christopher S. Foote
Publisher:Cengage Learning
IR Spectroscopy; Author: Professor Dave Explains;https://www.youtube.com/watch?v=_TmevMf-Zgs;License: Standard YouTube License, CC-BY