
a)
The graph of a hot dog stand under current market conditions by labeling the
a)
Explanation of Solution
The following graph represents the hot dog stand under current market conditions:
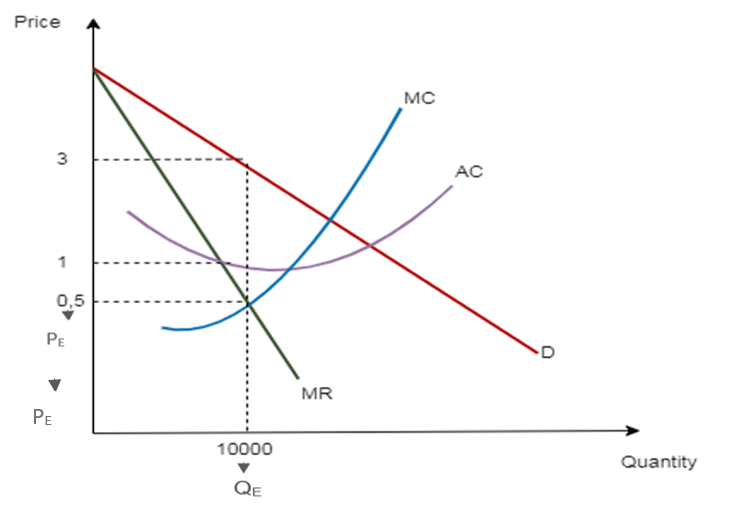
In this graph, the price is located on the vertical axis and the horizontal axis represents the quantity.
The equilibrium quantity is 10,000 which is shown on the graph by labeling QE and the equilibrium price is on the vertical axis which is labeled by PE.
Introduction: The marketing condition describes the state of a sector of the economy under which people utilize the marketing circumstances as an indicator to guide their judgments.
b)
The economic profit or loss for hot dog stand.
b)
Explanation of Solution
The economic profit for the hot dog stand would be calculated as:
Profit:
Here, P is the price and AC is the average cost
Introduction: The difference between the money collected from the sale of an output and the costs of all the inputs required, including the
c)
The shaded area of the profit or loss on the graph.
c)
Explanation of Solution
The graph will represent the area of profit as follows:
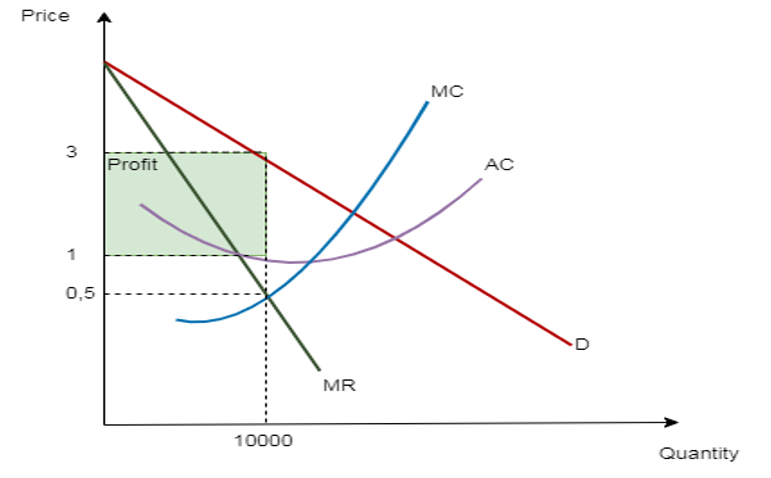
The shaded area indicates the area of profit.
Introduction: The difference between the money collected from the sale of an output and the costs of all the inputs required, including the opportunity costs as well, is known as an economic profit or loss.
d)
What will happen to the price and quantity of hot dog stand with the license fee?
d)
Explanation of Solution
The price of the usual hot dog stand will rise as a result of the license fee because the average cost curve will shift upward but, in this case, the number of hot dog stands will remain the same. It happens because marginal revenue and Marginal cost still intersect at the same location and the marginal cost remains constant.
Introduction: The difference between the money collected from the sale of an output and the costs of all the inputs required, including the opportunity costs as well, is known as an economic profit or loss.
e)
The impact of the license fee on the graph by labeling anything that changed.
e)
Explanation of Solution
After the impact of the license fee, the graph will be shown as:
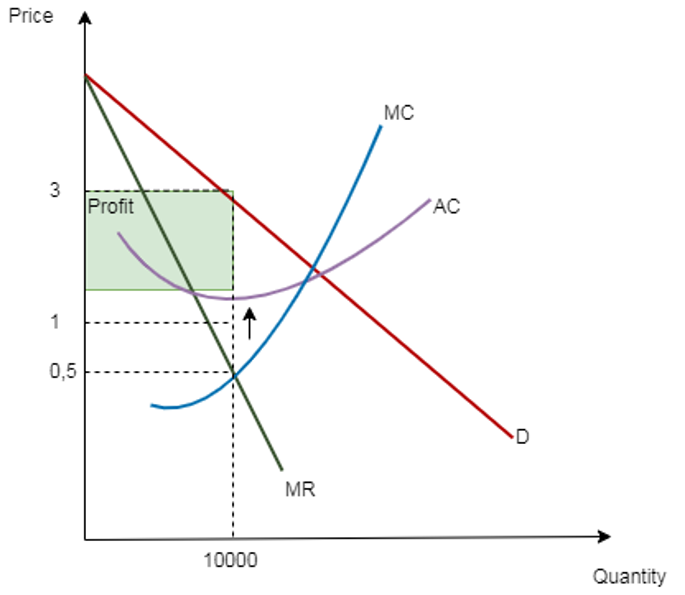
The graph shows that the average cost curve shifts upward by imposing a license fee which means the profit is affected by the license fee. Now, profit got smaller for hot dog stand.
Introduction: The difference between the money collected from the sale of an output and the costs of all the inputs required, including the opportunity costs as well, is known as an economic profit or loss.
f)
What would happen to the number of hot dog stands over the course of the season?
f)
Explanation of Solution
Many hot dog stands may exit the business during the course of the season. It can happen because the number of stands will decline with the decrease in profits of the industry over the course of the season. Firms don’t want to be part of the industry when there is no possibility of an increase in profits or the industry is already experiencing a decline in its earnings.
Introduction: The difference between the money collected from the sale of an output and the costs of all the inputs required, including the opportunity costs as well, is known as an economic profit or loss.
Chapter 12R Solutions
Krugman's Economics For The Ap® Course

- 17. The South African government's distributive stance is clear given its prioritisation of social spending, which includes grants and subsidised goods. Discuss the advantages and disadvantages of an in-kind subsidy versus a cash grant. Use a graphical illustration to support your arguments. [15] 18. Redistributive expenditure can take the form of direct cash transfers (grants) and/or in-kind subsidies. With references to the graphs below, discuss the merits of these two transfer types in the presence and absence of a positive externality. [14] 19. Expenditure on education and healthcare have, by far, the biggest redistributive effect in South Africa' by one estimate dropping the Gini-coefficient by 10 percentage points. Discuss the South African government's performance in health and education provision by evaluating both the outputs and outcomes in these areas of service delivery. [15] 20. Define the following concepts and provide an example in each case: tax rate structure, general…arrow_forwardSummarise the case for government intervention in the education marketarrow_forwardShould Maureen question the family about the history of the home? Can Maureen access public records for proof of repairs?arrow_forward
- 3. Distinguish between a direct democracy and a representative democracy. Use appropriate examples to support your answers. [4] 4. Explain the distinction between outputs and outcomes in social service delivery [2] 5. A R1000 tax payable by all adults could be viewed as both a proportional tax and a regressive tax. Do you agree? Explain. [4] 6. Briefly explain the displacement effect in Peacock and Wiseman's model of government expenditure growth and provide a relevant example of it in the South African context. [5] 7. Explain how unbalanced productivity growth may affect government expenditure and briefly comment on its relevance to South Africa. [5] 8. South Africa has recently proposed an increase in its value-added tax rate to 15%, sparking much controversy. Why is it argued that value-added tax is inequitable and what can be done to correct the inequity? [5] 9. Briefly explain the difference between access to education and the quality of education, and why we should care about the…arrow_forward20. Factors 01 pro B. the technological innovations available to companies. A. the laws that regulate manufacturers. C. the resources used to create output D. the waste left over after goods are produced. 21. Table 1.1 shows the tradeoff between different combinations of missile production and home construction, ceteris paribus. Complete the table by calculating the required opportunity costs for both missiles and houses. Then answer the indicated question(s). Combination Number of houses Opportunity cost of houses in Number of missiles terms of missiles J 0 4 K 10,000 3 L 17,000 2 1 M 21,000 0 N 23,000 Opportunity cost of missiles in terms of houses Tutorials-Principles of Economics m health carearrow_forwardIn a small open economy with a floating exchange rate, the supply of real money balances is fixed and a rise in government spending ______ Group of answer choices Raises the interest rate so that net exports must fall to maintain equilibrium in the goods market. Cannot change the interest rate so that net exports must fall to maintain equilibrium in the goods market. Cannot change the interest rate so income must rise to maintain equilibrium in the money market Raises the interest rate, so that income must rise to maintain equilibrium in the money market.arrow_forward
- Suppose a country with a fixed exchange rate decides to implement a devaluation of its currency and commits to maintaining the new fixed parity. This implies (A) ______________ in the demand for its goods and a monetary (B) _______________. Group of answer choices (A) expansion ; (B) contraction (A) contraction ; (B) expansion (A) expansion ; (B) expansion (A) contraction ; (B) contractionarrow_forwardAssume a small open country under fixed exchanges rate and full capital mobility. Prices are fixed in the short run and equilibrium is given initially at point A. An exogenous increase in public spending shifts the IS curve to IS'. Which of the following statements is true? Group of answer choices A new equilibrium is reached at point B. The TR curve will shift down until it passes through point B. A new equilibrium is reached at point C. Point B can only be reached in the absence of capital mobility.arrow_forwardA decrease in money demand causes the real interest rate to _____ and output to _____ in the short run, before prices adjust to restore equilibrium. Group of answer choices rise; rise fall; fall fall; rise rise; fallarrow_forward
- If a country's policy makers were to continously use expansionary monetary policy in an attempt to hold unemployment below the natural rate , the long urn result would be? Group of answer choices a decrease in the unemployment rate an increase in the level of output All of these an increase in the rate of inflationarrow_forwardA shift in the Aggregate Supply curve to the right will result in a move to a point that is southwest of where the economy is currently at. Group of answer choices True Falsearrow_forwardAn oil shock can cause stagflation, a period of higher inflation and higher unemployment. When this happens, the economy moves to a point to the northeast of where it currently is. After the economy has moved to the northeast, the Federal Reserve can reduce that inflation without having to worry about causing more unemployment. Group of answer choices True Falsearrow_forward

 Principles of Economics (12th Edition)EconomicsISBN:9780134078779Author:Karl E. Case, Ray C. Fair, Sharon E. OsterPublisher:PEARSON
 Engineering Economy (17th Edition)EconomicsISBN:9780134870069Author:William G. Sullivan, Elin M. Wicks, C. Patrick KoellingPublisher:PEARSON
 Principles of Economics (MindTap Course List)EconomicsISBN:9781305585126Author:N. Gregory MankiwPublisher:Cengage Learning
 Managerial Economics: A Problem Solving ApproachEconomicsISBN:9781337106665Author:Luke M. Froeb, Brian T. McCann, Michael R. Ward, Mike ShorPublisher:Cengage Learning
 Managerial Economics & Business Strategy (Mcgraw-...EconomicsISBN:9781259290619Author:Michael Baye, Jeff PrincePublisher:McGraw-Hill Education