
Videos
Chebyshev’s Theorem How can you determine whether a distribution is approximately normal? A statistical theorem called Chebyshev’s theorem states that the minimum percent of data between plus and minus K standard deviations from the mean (K > 1) in any distribution can be found by the formula
Minimum percent =
Thus, for example, between ±2 standard deviations from the mean there will always be a minimum of 75% of data. This minimum percent applies to any distribution For K = 2,
Minimum percent
Likewise, between ±3 standard deviations from the mean there will always be a minimum of 89% of the data. For K = 3,
Minimum percent
The following table lists the minimum percent of data in any distribution and the actual percent of data in the normal distribution between ±1.1, ± 1.5, ± 2.0, and ±2.5 standard deviations from the mean. The minimum percents of data m any distribution were calculated by using Chebyshev’s theorem. The actual percents of data for the normal distribution were calculated by using the area given in the standard normal, or z, table.
| K = 1.1 | K = 1.5 | K = 2 | K = 2.5 | |
| Minimum (for any distribution) | 17.4% | 55.6% | 75% | 84% |
| Normal distribution | 72.9% | 86.6% | 95.4% | 98.8% |
| Given distribution |
The third row of the chart has been left blank for you to fill in the percents when you reach part (e).
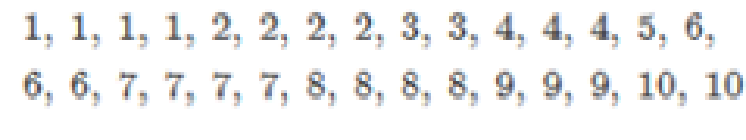
Consider the following 30 pieces of data obtained from a quiz.
- a. Determine the mean of the set of scores.
- b. Determine the standard deviation of the set of scores.
- c. Determine the values that correspond to 1.1, 1.5, 2, and 2.5 standard deviations above the mean. Then determine the values that correspond to 1.1, 1.5, 2, and 2. 5 standard deviations below the mean.
- d. By observing the 30 pieces of data, determine the actual percent of quiz scores between
±1.1 standard deviations from the mean.
±1.5 standard deviations from the mean.
±2 tandard deviations from the mean.
±2.5 standard deviations from the mean.
- e. Place the percents found in part (d) in the third row of the chart.
- f. Compare the percents in the third row of the chart with the minimum percents in the first row and the normal percents in the second row, and then make a judgment as to whether this set of 30 scores is approximately
normally distributed .
Want to see the full answer?
Check out a sample textbook solution
Chapter 12 Solutions
A SURVEY OF MATH 18 WK MML CODE


- 17. Suppose we know that the graph below is the graph of a solution to dy/dt = f(t). (a) How much of the slope field can you sketch from this information? [Hint: Note that the differential equation depends only on t.] (b) What can you say about the solu- tion with y(0) = 2? (For example, can you sketch the graph of this so- lution?) y(0) = 1 y ANarrow_forwardWrite out and explain your steps to each of these problems.arrow_forwardCalculate the area and perimeterarrow_forward
- 65% of all violent felons in the prison system are repeat offenders. If 43 violent felons are randomly selected, find the probability that a. Exactly 28 of them are repeat offenders. b. At most 28 of them are repeat offenders. c. At least 28 of them are repeat offenders. d. Between 22 and 26 (including 22 and 26) of them are repeat offenders.arrow_forward(b) Find the (instantaneous) rate of change of y at x = 5. In the previous part, we found the average rate of change for several intervals of decreasing size starting at x = 5. The instantaneous rate of change of fat x = 5 is the limit of the average rate of change over the interval [x, x + h] as h approaches 0. This is given by the derivative in the following limit. lim h→0 - f(x + h) − f(x) h The first step to find this limit is to compute f(x + h). Recall that this means replacing the input variable x with the expression x + h in the rule defining f. f(x + h) = (x + h)² - 5(x+ h) = 2xh+h2_ x² + 2xh + h² 5✔ - 5 )x - 5h Step 4 - The second step for finding the derivative of fat x is to find the difference f(x + h) − f(x). - f(x + h) f(x) = = (x² x² + 2xh + h² - ])- = 2x + h² - 5h ])x-5h) - (x² - 5x) = ]) (2x + h - 5) Macbook Proarrow_forwardEvaluate the integral using integration by parts. Sx² cos (9x) dxarrow_forward
- Let f be defined as follows. y = f(x) = x² - 5x (a) Find the average rate of change of y with respect to x in the following intervals. from x = 4 to x = 5 from x = 4 to x = 4.5 from x = 4 to x = 4.1 (b) Find the (instantaneous) rate of change of y at x = 4. Need Help? Read It Master Itarrow_forwardDetermine whether the inverse of f(x)=x^4+2 is a function. Then, find the inverse.arrow_forwardVelocity of a Ball Thrown into the Air The position function of an object moving along a straight line is given by s = f(t). The average velocity of the object over the time interval [a, b] is the average rate of change of f over [a, b]; its (instantaneous) velocity at t = a is the rate of change of f at a. A ball is thrown straight up with an initial velocity of 128 ft/sec, so that its height (in feet) after t sec is given by s = f(t) = 128t - 16t². (a) What is the average velocity of the ball over the following time intervals? [3,4] [3, 3.5] [3, 3.1] ft/sec ft/sec ft/sec (b) What is the instantaneous velocity at time t = 3? ft/sec (c) What is the instantaneous velocity at time t = 7? ft/sec Is the ball rising or falling at this time? O rising falling (d) When will the ball hit the ground? t = sec Need Help? Read It Watch Itarrow_forward
 Glencoe Algebra 1, Student Edition, 9780079039897...AlgebraISBN:9780079039897Author:CarterPublisher:McGraw Hill
 Big Ideas Math A Bridge To Success Algebra 1: Stu...AlgebraISBN:9781680331141Author:HOUGHTON MIFFLIN HARCOURTPublisher:Houghton Mifflin Harcourt