
Videos
How to Blow Your Job Interview The data in the bar graph at the top of the next column are from a random sample of 1910 job interviewers. The graph shows the top interviewer turnoffs and the percentage of surveyed interviewers who were offended by each of these behaviors.
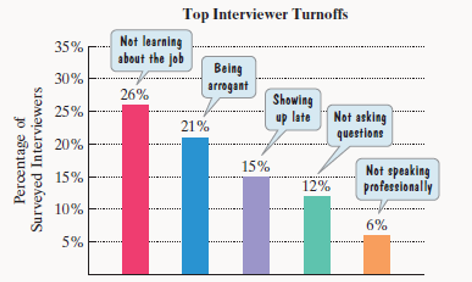
Source: Scott Erker. PhD., and Kelli Buczynski.“Are You Failing the Interview? 2009 Survey of Global Interviewing Practices and Perceptions." Development Dimensions International.
a. Find the margin of error to the nearest tenth of a percent, for this survey.
b. Write a statement about the percentage of interviewers in the population who are turned off by a job applicant being arrogant.

Trending nowThis is a popular solution!

Chapter 12 Solutions
Thinking Mathematically, Books a la Carte Edition plus MyLab Math with Pearson eText -- Access Card Package, 4/e (7th Edition)


- II Consider the following data matrix X: X1 X2 0.5 0.4 0.2 0.5 0.5 0.5 10.3 10 10.1 10.4 10.1 10.5 What will the resulting clusters be when using the k-Means method with k = 2. In your own words, explain why this result is indeed expected, i.e. why this clustering minimises the ESS map.arrow_forwardX Acellus | Student admin192c.acellus.com go 0:0 Hannah wants to have concrete stairs for her backdoor. How much concrete will be needed to build the stairs? 20 cm 70 cm 30 cm 15 cm 10 cm 45 cm cm 70 cm GIF 自 لاarrow_forwardwhy the answer is 3 and 10?arrow_forward
- 1 Hannah wants to have concrete stairs for her backdoor. How much concrete will be needed to build the stairs? 70 cm 30 cm 15 cm 10 cm 10 cm 20 cm 45 cm cm³ GIF GIF/ 2 3 4 qwe asdf 5 6 自 yu ty u 8 ghjk 9 P Z X C cv b vbnm ×arrow_forwardPS 9 Two films are shown on screen A and screen B at a cinema each evening. The numbers of people viewing the films on 12 consecutive evenings are shown in the back-to-back stem-and-leaf diagram. Screen A (12) Screen B (12) 8 037 34 7 6 4 0 534 74 1645678 92 71689 Key: 116|4 represents 61 viewers for A and 64 viewers for B A second stem-and-leaf diagram (with rows of the same width as the previous diagram) is drawn showing the total number of people viewing films at the cinema on each of these 12 evenings. Find the least and greatest possible number of rows that this second diagram could have. TIP On the evening when 30 people viewed films on screen A, there could have been as few as 37 or as many as 79 people viewing films on screen B.arrow_forwardskip A swimming pool plan has concrete stairs leading down into the shallow end How much concrete will be needed to build the stairs? Bift 9 ft 2 ft 1 ft 9 ft 2 ft 5 ft [ ? ] ft³arrow_forward
 Glencoe Algebra 1, Student Edition, 9780079039897...AlgebraISBN:9780079039897Author:CarterPublisher:McGraw Hill
 Big Ideas Math A Bridge To Success Algebra 1: Stu...AlgebraISBN:9781680331141Author:HOUGHTON MIFFLIN HARCOURTPublisher:Houghton Mifflin Harcourt
 Holt Mcdougal Larson Pre-algebra: Student Edition...AlgebraISBN:9780547587776Author:HOLT MCDOUGALPublisher:HOLT MCDOUGAL