
Thinking Mathematically, Books a la Carte Edition plus MyLab Math with Pearson eText -- Access Card Package, 4/e (7th Edition)
7th Edition
ISBN: 9780135222249
Author: Robert F. Blitzer
Publisher: PEARSON
expand_more
expand_more
format_list_bulleted
Concept explainers
Videos
Textbook Question
Chapter 12.1, Problem 27E
The frequency
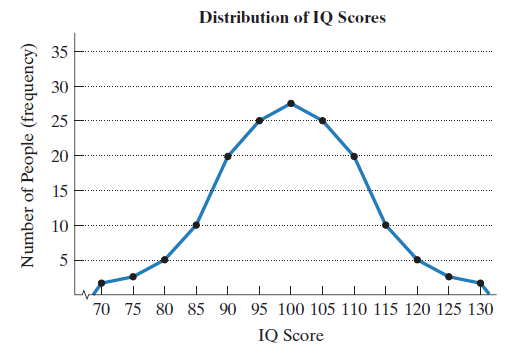
In Exercises 26-29, determine whether each statement is true or false according to the graph.
More people had an IQ score of 100 than any other IQ score, and as the deviation from 100 increases or decreases, the scores fall off in a symmetrical manner.
Expert Solution & Answer
Want to see the full answer?
Check out a sample textbook solution
Students have asked these similar questions
Business
Please answer first one
Answer number 2
Chapter 12 Solutions
Thinking Mathematically, Books a la Carte Edition plus MyLab Math with Pearson eText -- Access Card Package, 4/e (7th Edition)
Ch. 12.1 - CHECK POINT 1 A city government wants to conduct a...Ch. 12.1 - CHECK POINT 2 Explain why the sampling technique...Ch. 12.1 - CHECK POINT 3 Construct a frequency distribution...Ch. 12.1 - CHECK POINT 4 Use the classes in Table 12.3 to...Ch. 12.1 - CHECKPOINTS 5 Construct a stem-and-leaf plot for...Ch. 12.1 - A sample obtained in such a way that every member...Ch. 12.1 - Prob. 2CVCCh. 12.1 - Fill in each blank so that the resulting statement...Ch. 12.1 - 4. Data can be displayed using a bar graph with...Ch. 12.1 - Prob. 5CVC
Ch. 12.1 - A data presentation that separates each data item...Ch. 12.1 - In Exercises 7-10, determine whether each...Ch. 12.1 - Prob. 8CVCCh. 12.1 - In Exercises 7-10, determine whether each...Ch. 12.1 - Fill in each blank so that the resulting statement...Ch. 12.1 - 1. The government of a large city needs to...Ch. 12.1 - The city council of a large city needs to know...Ch. 12.1 - A questionnaire was given to students in an...Ch. 12.1 - A questionnaire was given to students in an...Ch. 12.1 - A questionnaire was given to students in an...Ch. 12.1 - A questionnaire was given to students in an...Ch. 12.1 - 7. A random sample of 30 college students is...Ch. 12.1 - 8. A random sample of 30 male college students is...Ch. 12.1 - A college professor had students keep a diary of...Ch. 12.1 - A college professor had students keep a diary of...Ch. 12.1 - A college professor had students keep a diary of...Ch. 12.1 - A college professor had students keep a diary of...Ch. 12.1 - A college professor had students keep a diary of...Ch. 12.1 - A college professor had students keep a diary of...Ch. 12.1 - A college professor had students keep a diary of...Ch. 12.1 - A college professor had students keep a diary of...Ch. 12.1 - The IQ scores of 70 students enrolled in a liberal...Ch. 12.1 - Construct a histogram and a frequency polygon for...Ch. 12.1 - 20. Construct a histogram and a frequency polygon...Ch. 12.1 - 21. Construct a histogram and a frequency polygon...Ch. 12.1 - In Exercises 22-25, determine whether each...Ch. 12.1 - In Exercises 22-25, determine whether each...Ch. 12.1 - In Exercises 22-25, determine whether each...Ch. 12.1 - In Exercises 22-25, determine whether each...Ch. 12.1 - The frequency polygon shows a distribution of IQ...Ch. 12.1 - The frequency polygon shows a distribution of IQ...Ch. 12.1 - The frequency polygon shows a distribution of IQ...Ch. 12.1 - The frequency polygon shows a distribution of IQ...Ch. 12.1 - 30. Construct a stem-and-leaf plot for the data in...Ch. 12.1 - 31. A random sample of 40 college professors is...Ch. 12.1 - In "Ages of Oscar-Winning Best Actors and...Ch. 12.1 - Prob. 33ECh. 12.1 - Prob. 34ECh. 12.1 - Prob. 35ECh. 12.1 - In Exercises 33-37, describe what is misleading in...Ch. 12.1 - In Exercises 33-37, describe what is misleading in...Ch. 12.1 - What is a population? What is a sample?Ch. 12.1 - Prob. 39ECh. 12.1 - 40. Suppose you are interested in whether or not...Ch. 12.1 - For Exercise 40, would questioning every fifth...Ch. 12.1 - What is a frequency distribution?Ch. 12.1 - What is a histogram?Ch. 12.1 - What is a frequency polygon?Ch. 12.1 - 45. Describe how to construct a frequency polygon...Ch. 12.1 - Prob. 46ECh. 12.1 - Prob. 47ECh. 12.1 - Make Sense? In Exercises 48-51, determine whether...Ch. 12.1 - Make Sense? In Exercises 48-51, determine whether...Ch. 12.1 - Make Sense? In Exercises 48-51, determine whether...Ch. 12.1 - Make Sense? In Exercises 48-51, determine whether...Ch. 12.1 - 52. Construct a grouped frequency distribution for...Ch. 12.1 - The classic book on distortion using statistics is...Ch. 12.1 - 54. Each group member should find one example of a...Ch. 12.2 - CHECK POINT 1 Use Figure 12.6 to find the mean...Ch. 12.2 - $$ CHECK POINT 2 Find the mean, $$, for the data...Ch. 12.2 - CHECK POINT 3 Find the median for each of the...Ch. 12.2 - CHECK POINT 4 Find the median for the following...Ch. 12.2 - CHECK POINT 5 Arrange the data items for eating in...Ch. 12.2 - CHECK POINT 6 Find the median for the following...Ch. 12.2 - CHECK POINT 7 Table 12.9 shows the net worth, in...Ch. 12.2 - CHECK POINT 8 Find the mode for each of the...Ch. 12.2 - CHECK POINT 9 Use Table 12.12 on the previous page...Ch. 12.2 - CHECK POINT 10 Consumer Reports magazine gave the...Ch. 12.2 - 1. the sum of all the data items divided by the...Ch. 12.2 - 2. The measure of central tendency that is the...Ch. 12.2 - Prob. 3CVCCh. 12.2 - Prob. 4CVCCh. 12.2 - Prob. 5CVCCh. 12.2 - In Exercises 6-9, determine whether each statement...Ch. 12.2 - Prob. 7CVCCh. 12.2 - In Exercises 6-9, determine whether each statement...Ch. 12.2 - In Exercises 6-9, determine whether each statement...Ch. 12.2 - In Exercises 1-8, find the mean for each group of...Ch. 12.2 - In Exercises 1-8, find the mean for each group of...Ch. 12.2 - Prob. 3ECh. 12.2 - In Exercises 1-8, find the mean for each group of...Ch. 12.2 - In Exercises 1-8, find the mean for each group of...Ch. 12.2 - In Exercises 1-8, find the mean for each group of...Ch. 12.2 - Prob. 7ECh. 12.2 - In Exercises 1-8, find the mean for each group of...Ch. 12.2 - In Exercises 9-12, find the mean for the data...Ch. 12.2 - In Exercises 9-12, find the mean for the data...Ch. 12.2 - In Exercises 9-12, find the mean for the data...Ch. 12.2 - In Exercises 9-12, find the mean for the data...Ch. 12.2 - In Exercises 13-20, find the median for each group...Ch. 12.2 - In Exercises 13-20, find the median for each group...Ch. 12.2 - In Exercises 13-20, find the median for each group...Ch. 12.2 - In Exercises 13-20, find the median for each group...Ch. 12.2 - In Exercises 13-20, find the median for each group...Ch. 12.2 - Prob. 18ECh. 12.2 - In Exercises 13-20, find the median for each group...Ch. 12.2 - In Exercises 13-20, find the median for each group...Ch. 12.2 - Find the median for the data items in the...Ch. 12.2 - Prob. 22ECh. 12.2 - Find the median for the data items in the...Ch. 12.2 - Find the median for the data items in the...Ch. 12.2 - In Exercises 25-32, find the mode for each group...Ch. 12.2 - Prob. 26ECh. 12.2 - In Exercises 25-32, find the mode for each group...Ch. 12.2 - In Exercises 25-32, find the mode for each group...Ch. 12.2 - In Exercises 25-32, find the mode for each group...Ch. 12.2 - In Exercises 25-32, find the mode for each group...Ch. 12.2 - In Exercises 25-32, find the mode for each group...Ch. 12.2 - In Exercises 25-32, find the mode for each group...Ch. 12.2 - Prob. 33ECh. 12.2 - Find the mode for the data items in the frequency...Ch. 12.2 - Prob. 35ECh. 12.2 - Find the mode for the data items in the frequency...Ch. 12.2 - In Exercises 37-44, find the midrange for each...Ch. 12.2 - Prob. 38ECh. 12.2 - In Exercises 37-44, find the midrange for each...Ch. 12.2 - In Exercises 37-44, find the midrange for each...Ch. 12.2 - In Exercises 37-44, find the midrange for each...Ch. 12.2 - Prob. 42ECh. 12.2 - Prob. 43ECh. 12.2 - In Exercises 37-44, find the midrange for each...Ch. 12.2 - Prob. 45ECh. 12.2 - Prob. 46ECh. 12.2 - Find the midrange for the data items in the...Ch. 12.2 - Find the midrange for the data items in the...Ch. 12.2 - In Exercises 49-54, use each display of data items...Ch. 12.2 - In Exercises 49-54, use each display of data items...Ch. 12.2 - In Exercises 49-54, use each display of data items...Ch. 12.2 - In Exercises 49-54, use each display of data items...Ch. 12.2 - Prob. 53ECh. 12.2 - In Exercises 49-54, use each display of data items...Ch. 12.2 - Exercises 55-57 present data on a variety of...Ch. 12.2 - Exercises 55-57 present data on a variety of...Ch. 12.2 - Prob. 57ECh. 12.2 - The weights (to the nearest five pounds) of 40...Ch. 12.2 - Prob. 59ECh. 12.2 - The weights (to the nearest five pounds) of 40...Ch. 12.2 - The weights (to the nearest five pounds) of 40...Ch. 12.2 - 62. An advertisement for a speed-reading course...Ch. 12.2 - Prob. 63ECh. 12.2 - 64. What is the mean and how is it obtained?
Ch. 12.2 - Prob. 65ECh. 12.2 - Prob. 66ECh. 12.2 - Prob. 67ECh. 12.2 - 68. The "average" income in the United States can...Ch. 12.2 - Prob. 69ECh. 12.2 - Prob. 70ECh. 12.2 - A student's parents promise to pay for next...Ch. 12.2 - According to the National Oceanic and Atmospheric...Ch. 12.2 - Prob. 73ECh. 12.2 - Make Sense? In Exercises 73-76, determine whether...Ch. 12.2 - Prob. 75ECh. 12.2 - Make Sense? Exercises 73-76, determine whether...Ch. 12.2 - Prob. 77ECh. 12.2 - On an examination given to 30 students, no student...Ch. 12.2 - Select a characteristic, such as shoe size or...Ch. 12.2 - A book on spotting bad statistics and learning to...Ch. 12.3 - CHECKPOINT 1 Find the range for the following...Ch. 12.3 - CHECK POINT 2 Compute the mean for the following...Ch. 12.3 - CHECK POINT 3 Find the standard deviation for the...Ch. 12.3 - CHECK POINT 4 Find the standard deviation of the...Ch. 12.3 - CHECK POINT 5 Shown below are the means and...Ch. 12.3 - Fill in each blank so that the resulting statement...Ch. 12.3 - Fill in each blank so that the resulting statement...Ch. 12.3 - Fill in each blank so that the resulting statement...Ch. 12.3 - Fill in each blank so that the resulting statement...Ch. 12.3 - Fill in each blank so that the resulting statement...Ch. 12.3 - In Exercises 1-6, find the range for each group of...Ch. 12.3 - In Exercises 1-6, find the range for each group of...Ch. 12.3 - In Exercises 1-6, find the range for each group of...Ch. 12.3 - In Exercises 1-6, find the range for each group of...Ch. 12.3 - In Exercises 1-6, find the range for each group of...Ch. 12.3 - Prob. 6ECh. 12.3 - In Exercises 7-10, a group of data items and their...Ch. 12.3 - In Exercises 7-10, a group of data items and their...Ch. 12.3 - In Exercises 7-10, a group of data items and their...Ch. 12.3 - Prob. 10ECh. 12.3 - In Exercises 11-16, find a. the mean; b. the...Ch. 12.3 - In Exercises 11-16, find a. the mean; b. the...Ch. 12.3 - Prob. 13ECh. 12.3 - Prob. 14ECh. 12.3 - In Exercises 11-16, find a. the mean; b. the...Ch. 12.3 - In Exercises 11-16, find a. the mean; b. the...Ch. 12.3 - In Exercises 17-26, find the standard deviation...Ch. 12.3 - Prob. 18ECh. 12.3 - Prob. 19ECh. 12.3 - In Exercises 17-26, find the standard deviation...Ch. 12.3 - In Exercises 17-26, find the standard deviation...Ch. 12.3 - In Exercises 17-26, find the standard deviation...Ch. 12.3 - Prob. 23ECh. 12.3 - In Exercises 17-26, find the standard deviation...Ch. 12.3 - Prob. 25ECh. 12.3 - In Exercises 17-26, find the standard deviation...Ch. 12.3 - In Exercises 27-28, compute the mean, range, and...Ch. 12.3 - In Exercises 27-28, compute the mean, range, and...Ch. 12.3 - In Exercises 29-36, use each display of data items...Ch. 12.3 - In Exercises 29-36, use each display of data items...Ch. 12.3 - In Exercises 29-36, use each display of data items...Ch. 12.3 - In Exercises 29-36, use each display of data items...Ch. 12.3 - In Exercises 29-36, use each display of data items...Ch. 12.3 - In Exercises 29-36, use each display of data items...Ch. 12.3 - Prob. 35ECh. 12.3 - In Exercises 29-36, use each display of data items...Ch. 12.3 - The data sets give the number of platinum albums...Ch. 12.3 - The data sets give the ages of the first six U.S....Ch. 12.3 - Describe how to find the range of a data set.Ch. 12.3 - Describe why the range might not be the best...Ch. 12.3 - Describe how the standard deviation is computed.Ch. 12.3 - 42. Describe what the standard deviation reveals...Ch. 12.3 - If a set of test scores has a standard deviation...Ch. 12.3 - Two classes took a statistics test. Both classes...Ch. 12.3 - Prob. 45ECh. 12.3 - Over a one-month period, stock A had a mean daily...Ch. 12.3 - Make Sense? Exercises 47-50, determine whether...Ch. 12.3 - Prob. 48ECh. 12.3 - Make Sense? In Exercises 47-50, determine whether...Ch. 12.3 - Make Sense? Exercises 47-50, determine whether...Ch. 12.3 - 51. Describe a situation in which a relatively...Ch. 12.3 - If a set of test scores has a large range but a...Ch. 12.3 - Prob. 53ECh. 12.3 - Use the data 0, 1, 3, 4, 4, 6. Add 2 to each of...Ch. 12.3 - Prob. 55ECh. 12.3 - 56. Group members should consult a current almanac...Ch. 12.4 - CHECK POINT 1 Female adult heights in North...Ch. 12.4 - CHECK POINT 2 Use the distribution of male adult...Ch. 12.4 - CHECK POINT 3 The length of horse pregnancies from...Ch. 12.4 - CHECK POINT 4 The SAT (Scholastic Aptitude Test)...Ch. 12.4 - CHECK POINT 5 Use the information in Example 5 to...Ch. 12.4 - CHECK POINT 6 A student scored in the 75th...Ch. 12.4 - CHECK POINI 7 A Harris Poll of 2513 US. adults...Ch. 12.4 - Prob. 1CVCCh. 12.4 - Prob. 2CVCCh. 12.4 - Fill in each blank so that the resulting statement...Ch. 12.4 - Prob. 4CVCCh. 12.4 - Prob. 5CVCCh. 12.4 - Prob. 6CVCCh. 12.4 - Prob. 7CVCCh. 12.4 - Prob. 8CVCCh. 12.4 - The scores on a test are normally distributed with...Ch. 12.4 - The scores on a test are normally distributed with...Ch. 12.4 - The scores on a test are normally distributed with...Ch. 12.4 - The scores on a test are normally distributed with...Ch. 12.4 - Prob. 5ECh. 12.4 - The scores on a test are normally distributed with...Ch. 12.4 - The scores on a test are normally distributed with...Ch. 12.4 - The scores on a test are normally distributed with...Ch. 12.4 - Prob. 9ECh. 12.4 - The scores on a test are normally distributed with...Ch. 12.4 - Not everyone pays the same price for the same...Ch. 12.4 - Not everyone pays the same price for the same...Ch. 12.4 - Not everyone pays the same price for the same...Ch. 12.4 - Not everyone pays the same price for the same...Ch. 12.4 - Not everyone pays the same price for the same...Ch. 12.4 - Not everyone pays the same price for the same...Ch. 12.4 - Not everyone pays the same price for the same...Ch. 12.4 - Prob. 18ECh. 12.4 - Not everyone pays the same price for the same...Ch. 12.4 - Not everyone pays the same price for the same...Ch. 12.4 - Not everyone pays the same price for the same...Ch. 12.4 - Prob. 22ECh. 12.4 - Intelligence quotients (IQs) on the Stanford-Binet...Ch. 12.4 - Intelligence quotients (IQs) on the Stanford-...Ch. 12.4 - Intelligence quotients (IQs) on the Stanford-...Ch. 12.4 - Intelligence quotients (IQs) on the Stanford-...Ch. 12.4 - Intelligence quotients (IQs) on the Stanford-Binet...Ch. 12.4 - Intelligence quotients (IQs) on the Stanford-Binet...Ch. 12.4 - Intelligence quotients (IQs) on the Stanford-...Ch. 12.4 - Intelligence quotients (IQs) on the Stanford-...Ch. 12.4 - Intelligence quotients (IQs) on the Stanford-...Ch. 12.4 - Intelligence quotients (IQs) on the Stanford-Binet...Ch. 12.4 - Prob. 33ECh. 12.4 - A set of data items is normally distributed with a...Ch. 12.4 - Prob. 35ECh. 12.4 - A set of data items is normally distributed with a...Ch. 12.4 - A set of data items is normally distributed with a...Ch. 12.4 - Prob. 38ECh. 12.4 - A set of data items is normally distributed with a...Ch. 12.4 - A set of data items is normally distributed with a...Ch. 12.4 - A set of data items is normally distributed with a...Ch. 12.4 - Prob. 42ECh. 12.4 - Prob. 43ECh. 12.4 - A set of data items is normally distributed with a...Ch. 12.4 - A set of data items is normally distributed with a...Ch. 12.4 - A set of data items is normally distributed with a...Ch. 12.4 - Prob. 47ECh. 12.4 - A set of data items is normally distributed with a...Ch. 12.4 - Scores on a denial anxiety scale range from 0 (no...Ch. 12.4 - Prob. 50ECh. 12.4 - Scores on a denial anxiety scale range from 0 (no...Ch. 12.4 - Scores on a denial anxiety scale range from 0 (no...Ch. 12.4 - Prob. 53ECh. 12.4 - Scores on a denial anxiety scale range from 0 (no...Ch. 12.4 - Prob. 55ECh. 12.4 - Scores on a denial anxiety scale range from 0 (no...Ch. 12.4 - Intelligence quotients on the Stanford-Binet...Ch. 12.4 - Prob. 58ECh. 12.4 - A set of data items is normally distributed with a...Ch. 12.4 - A set of data items is normally distributed with a...Ch. 12.4 - A set of data items is normally distributed with a...Ch. 12.4 - A set of data items is normally distributed with a...Ch. 12.4 - Prob. 63ECh. 12.4 - A set of data items is normally distributed with a...Ch. 12.4 - A set of data items is normally distributed with a...Ch. 12.4 - A set of data items is normally distributed with a...Ch. 12.4 - Reducing Gun Violence The data in the bar graph...Ch. 12.4 - How to Blow Your Job Interview The data in the bar...Ch. 12.4 - Prob. 69ECh. 12.4 - Using a random sample of 4000 TV households...Ch. 12.4 - 71. In 1997.Nielsen Media Research increased its...Ch. 12.4 - If Nielsen Media Research were to increase its...Ch. 12.4 - a. Is the shape of this distribution best...Ch. 12.4 - 74. a. Find the median murder rate per 100.000...Ch. 12.4 - 75. What is a symmetric histogram?
Ch. 12.4 - Prob. 76ECh. 12.4 - 77. Describe the 68-95-99.7 Rule.
Ch. 12.4 - Prob. 78ECh. 12.4 - What does a z-score measure?Ch. 12.4 - Prob. 80ECh. 12.4 - 81. Describe when a z-score is negative.
Ch. 12.4 - If you score in the 83rd percentile, what does...Ch. 12.4 - Prob. 83ECh. 12.4 - Prob. 84ECh. 12.4 - Prob. 85ECh. 12.4 - Give an example of a phenomenon that is not...Ch. 12.4 - Make Sense? In Exercises 87-90, determine whether...Ch. 12.4 - Make Sense? In Exercises 87-90, determine whether...Ch. 12.4 - Make sense? In Exercises 87-90, determine whether...Ch. 12.4 - Make Sense? In Exercises 87-90, determine whether...Ch. 12.5 - CHECK POINT I The distribution of monthly charges...Ch. 12.5 - CHECK POINT 2 Female adult heights in North...Ch. 12.5 - Prob. 3CPCh. 12.5 - Prob. 1CVCCh. 12.5 - Prob. 2CVCCh. 12.5 - Prob. 3CVCCh. 12.5 - Prob. 4CVCCh. 12.5 - Use the information shown below to fill in each...Ch. 12.5 - In Exercises 1-8, find the percentage of data...Ch. 12.5 - In Exercises 1-8, find the percentage of data...Ch. 12.5 - Prob. 3ECh. 12.5 - In Exercises 1-8, find the percentage of data...Ch. 12.5 - Prob. 5ECh. 12.5 - In Exercises 1-8, find the percentage of data...Ch. 12.5 - Prob. 7ECh. 12.5 - In Exercises 1-8, find the percentage of data...Ch. 12.5 - In Exercises 9-16, find the percentage of data...Ch. 12.5 - In Exercises 9-16, find the percentage of data...Ch. 12.5 - In Exercises 9-16, find the percentage of data...Ch. 12.5 - In Exercises 9-16, find the percentage of data...Ch. 12.5 - In Exercises 9-16, find the percentage of data...Ch. 12.5 - In Exercises 9-16, find the percentage of data...Ch. 12.5 - Prob. 15ECh. 12.5 - In Exercises 9-16, find the percentage of data...Ch. 12.5 - Systolic blood pressure readings are normally...Ch. 12.5 - Systolic blood pressure readings are normally...Ch. 12.5 - Systolic blood pressure readings are normally...Ch. 12.5 - Systolic blood pressure readings are normally...Ch. 12.5 - Systolic blood pressure readings are normally...Ch. 12.5 - Systolic blood pressure readings are normally...Ch. 12.5 - Prob. 23ECh. 12.5 - Systolic blood pressure readings are normally...Ch. 12.5 - Prob. 25ECh. 12.5 - Systolic blood pressure readings are normally...Ch. 12.5 - Prob. 27ECh. 12.5 - The weights for 12-month-old baby boys are...Ch. 12.5 - The weights for 12-month-old baby boys are...Ch. 12.5 - The weights for 12-month-old baby boys are...Ch. 12.5 - The table shows selected ages of licensed drivers...Ch. 12.5 - The table shows selected ages of licensed drivers...Ch. 12.5 - Prob. 33ECh. 12.5 - The table shows selected ages of licensed drivers...Ch. 12.5 - The table shows selected ages of licensed drivers...Ch. 12.5 - The table shows selected ages of licensed drivers...Ch. 12.5 - Writing in Mathematics
37.
Explain when it is...Ch. 12.5 - Writing in Mathematics Explain how to use a table...Ch. 12.5 - Make Sense? In Exercises 39-42, determine whether...Ch. 12.5 - Make Sense? In Exercises 39-42, determine whether...Ch. 12.5 - Make Sense? In Exercises 39-42, determine whether...Ch. 12.5 - Make Sense? In Exercises 39-42, determine whether...Ch. 12.5 - Find two z-scores so that 40% of the data in the...Ch. 12.5 - 44. A woman insists that she will never marry a...Ch. 12.5 - 45. The placement lest for a college has scores...Ch. 12.6 - CHECK POINT 1 In a 1996 study involving obesity in...Ch. 12.6 - CHECK POINT 2 The points in the scatter plot in...Ch. 12.6 - CHECK POINT 3 Use the data in Figure 1230 of Check...Ch. 12.6 - CHECK POINT 4 If you worked Check Point 2...Ch. 12.6 - Fill in each blank so that the resulting statement...Ch. 12.6 - Fill in each blank so that the resulting statement...Ch. 12.6 - Fill in each blank so that the resulting statement...Ch. 12.6 - Prob. 4CVCCh. 12.6 - Prob. 5CVCCh. 12.6 - Prob. 6CVCCh. 12.6 - In Exercises 4-7, determine whether each statement...Ch. 12.6 - In Exercises 1-8, make a scatter plot for the...Ch. 12.6 - In Exercises 1-8, make a scatter plot for the...Ch. 12.6 - In Exercises 1-8, make a scatter plot for the...Ch. 12.6 - In Exercises 1-8, make a scatter plot for the...Ch. 12.6 - Prob. 5ECh. 12.6 - In Exercises 1-8, make a scatter plot for the...Ch. 12.6 - In Exercises 1-8, make a scatter plot for the...Ch. 12.6 - In Exercises 1-8, make a scatter plot for the...Ch. 12.6 - The scatter plot in the figure shows the...Ch. 12.6 - The scatter plot in the figure shows the...Ch. 12.6 - The scatter plot in the figure shows the...Ch. 12.6 - The scatter plot in the figure shows the...Ch. 12.6 - The scatter plot in the figure shows the...Ch. 12.6 - The scatter plot in the figure shows the...Ch. 12.6 - The scatter plot in the figure shows the...Ch. 12.6 - The scatter plot in the figure shows the...Ch. 12.6 - The scatter plot in the figure shows the...Ch. 12.6 - The scalier plot in the figure shows the...Ch. 12.6 - Prob. 19ECh. 12.6 - Just as money doesn't buy happiness for...Ch. 12.6 - Just as money doesn't buy happiness for...Ch. 12.6 - Just as money doesn't buy happiness for...Ch. 12.6 - Just as money doesn't buy happiness for...Ch. 12.6 - Just as money doesn't buy happiness for...Ch. 12.6 - Just as money doesn't buy happiness for...Ch. 12.6 - Just as money doesn't buy happiness for...Ch. 12.6 - Use the scatter plots shown labeled (a)-(f), to...Ch. 12.6 - Use the scatter plots shown labeled (a)-(f), to...Ch. 12.6 - Use the scatter plots shown labeled (a)-(f), to...Ch. 12.6 - Use the scatter plots shown labeled (a)-(f), to...Ch. 12.6 - Compute r, the correlation coefficient, rounded to...Ch. 12.6 - Compute r, the correlation coefficient, rounded to...Ch. 12.6 - Compute r, the correlation coefficient, rounded to...Ch. 12.6 - Compute r, the correlation coefficient, rounded to...Ch. 12.6 - 35. Use the data in Exercise 5 to solve this...Ch. 12.6 - 36. Use the data in Exercise 6 to solve this...Ch. 12.6 - 37. Use the data in Exercise 7 to solve this...Ch. 12.6 - 38. Use the data in Exercise 8 to solve this...Ch. 12.6 - Prob. 39ECh. 12.6 - In Exercises 39-45, the correlation coefficient,...Ch. 12.6 - In Exercises 39-45, the correlation coefficient,...Ch. 12.6 - Prob. 42ECh. 12.6 - Prob. 43ECh. 12.6 - Prob. 44ECh. 12.6 - Prob. 45ECh. 12.6 - Prob. 46ECh. 12.6 - 47. What is a scatter plot?
Ch. 12.6 - How does a scatter plot indicate that two...Ch. 12.6 - Give an example of two variables with a strong...Ch. 12.6 - 50. Give an example of two variables with a strong...Ch. 12.6 - 51. What is meant by a regression line?
Ch. 12.6 - Prob. 52ECh. 12.6 - Prob. 53ECh. 12.6 - Prob. 54ECh. 12.6 - Prob. 55ECh. 12.6 - Prob. 56ECh. 12.6 - 57. Explain how to use the correlation coefficient...Ch. 12.6 - Prob. 58ECh. 12.6 - Make Sense? In Exercises 58-61, determine whether...Ch. 12.6 - Prob. 60ECh. 12.6 - Make Sense? In Exercises 58-61, determine whether...Ch. 12.6 - Prob. 62ECh. 12.6 - Use the linear regression feature of a graphing...Ch. 12.6 - 64. The group should select two variables related...Ch. 12.6 - Prob. 65ECh. 12 - 1. The government of a large city wants to know if...Ch. 12 - A random sample of ten college students is...Ch. 12 - A random sample of ten college students is...Ch. 12 - Prob. 4RECh. 12 - The 50 grades on a physiology lest are shown. Use...Ch. 12 - The 50 grades on a physiology test are shown. Use...Ch. 12 - Describe what is misleading about the size of the...Ch. 12 - In Exercises 8-9, find the mean for each group of...Ch. 12 - In Exercises 8-9, find the mean for each group of...Ch. 12 - Find the mean for the data items in the given...Ch. 12 - In Exercises 11-12, find the median for each group...Ch. 12 - In Exercises 11-12, find the median for each group...Ch. 12 - Find the median for the data items in the...Ch. 12 - In Exercises 14-15, find the mode for each group...Ch. 12 - In Exercises 14-15, find the mode for each group...Ch. 12 - 16. Find the mode for the data items in the...Ch. 12 - In Exercises 17-18, find the midrange for each...Ch. 12 - Prob. 18RECh. 12 - Prob. 19RECh. 12 - Prob. 20RECh. 12 - The data items below are the ages of U.S....Ch. 12 - Prob. 22RECh. 12 - Prob. 23RECh. 12 - Prob. 24RECh. 12 - Use the data items 36, 26, 24, 90, and 74 to find...Ch. 12 - Prob. 26RECh. 12 - Prob. 27RECh. 12 - Prob. 28RECh. 12 - Prob. 29RECh. 12 - 30. Describe how you would determine
a. which of...Ch. 12 - Prob. 31RECh. 12 - Prob. 32RECh. 12 - Prob. 33RECh. 12 - Prob. 34RECh. 12 - Prob. 35RECh. 12 - Prob. 36RECh. 12 - Prob. 37RECh. 12 - Prob. 38RECh. 12 - Prob. 39RECh. 12 - Prob. 40RECh. 12 - Prob. 41RECh. 12 - Prob. 42RECh. 12 - Prob. 43RECh. 12 - Prob. 44RECh. 12 - Prob. 45RECh. 12 - Prob. 46RECh. 12 - Prob. 47RECh. 12 - Prob. 48RECh. 12 - Prob. 49RECh. 12 - Prob. 50RECh. 12 - The histogram indicates the frequencies of the...Ch. 12 - The mean cholesterol level for all men in the...Ch. 12 - Prob. 53RECh. 12 - The mean cholesterol level for all men in the...Ch. 12 - The mean cholesterol level for all men in the...Ch. 12 - Prob. 56RECh. 12 - Prob. 57RECh. 12 - Prob. 58RECh. 12 - Prob. 59RECh. 12 - Prob. 60RECh. 12 - 61. There is a perfect negative correlation...Ch. 12 - 62. As the percentage of adult females who are...Ch. 12 - 63. The country with the least percentage of adult...Ch. 12 - Prob. 64RECh. 12 - Prob. 65RECh. 12 - Prob. 66RECh. 12 - Prob. 67RECh. 12 - Prob. 68RECh. 12 - Prob. 69RECh. 12 - Prob. 70RECh. 12 - Prob. 1TCh. 12 - Prob. 2TCh. 12 - Prob. 3TCh. 12 - Prob. 4TCh. 12 - Prob. 5TCh. 12 - Prob. 6TCh. 12 - Prob. 7TCh. 12 - Prob. 8TCh. 12 - Prob. 9TCh. 12 - Prob. 10TCh. 12 - Prob. 11TCh. 12 - Prob. 12TCh. 12 - Prob. 13TCh. 12 - Prob. 14TCh. 12 - Prob. 15TCh. 12 - Prob. 16TCh. 12 - Prob. 17TCh. 12 - Prob. 18TCh. 12 - Prob. 19TCh. 12 - 20. Use the percentiles in the table shown below...Ch. 12 - 21. Using a random sample of 100 students from a...Ch. 12 - Prob. 22TCh. 12 - Prob. 23TCh. 12 - Prob. 24TCh. 12 - Prob. 25TCh. 12 - 26. Is the relationship between the price of gas...
Knowledge Booster


Learn more about
Need a deep-dive on the concept behind this application? Look no further. Learn more about this topic, subject and related others by exploring similar questions and additional content below.Similar questions
- Answer number 1arrow_forwardUse a calculator to find a decimal approximation for the following trigonometric function. cot 226°54' cot 226°54' (Simplify your answer. Type an integer or a decimal. Round to eight decimal places as needed.)arrow_forwardIn preparing for the upcoming holiday season, Fresh Toy Company (FTC) designed a new doll called The Dougie that teaches children how to dance. The fixed cost to produce the doll is $100,000. The variable cost, which includes material, labor, and shipping costs, is $31 per doll. During the holiday selling season, FTC will sell the dolls for $39 each. If FTC overproduces the dolls, the excess dolls will be sold in January through a distributor who has agreed to pay FTC $10 per doll. Demand for new toys during the holiday selling season is extremely uncertain. Forecasts are for expected sales of 60,000 dolls with a standard deviation of 15,000. The normal probability distribution is assumed to be a good description of the demand. FTC has tentatively decided to produce 60,000 units (the same as average demand), but it wants to conduct an analysis regarding this production quantity before finalizing the decision. (a) Determine the equation for computing FTC's profit for given values of the…arrow_forward
- For all integers a and b, (a + b)^3 ≡ a^3 + b^3 (mod 3).arrow_forwardFind a plane containing the point (3, -3, 1) and the line of intersection of the planes 2x + 3y - 3z = 14 and -3x - y + z = −21. The equation of the plane is:arrow_forwardDetermine whether the lines L₁ : F(t) = (−2, 3, −1)t + (0,2,-3) and L2 : ƒ(s) = (2, −3, 1)s + (−10, 17, -8) intersect. If they do, find the point of intersection. ● They intersect at the point They are skew lines They are parallel or equalarrow_forward
- Answer number 15arrow_forwardWhy researchers are interested in describing measures of the center and measures of variation of a data set?arrow_forwardLet Χ be a real-valued character (mod k). Let k S = Σnx(n). n=1 If (a, k) = 1, ax(a)S = S (mod k). (iii) Write k = 2ºq where q is odd. Show that there is an integer a with (a, k) = 1 such that a = 3 (mod 2ª) and a = 2 (mod q). Deduce that 12S = 0 (mod k).arrow_forward
arrow_back_ios
SEE MORE QUESTIONS
arrow_forward_ios
Recommended textbooks for you
 Glencoe Algebra 1, Student Edition, 9780079039897...AlgebraISBN:9780079039897Author:CarterPublisher:McGraw Hill
 Holt Mcdougal Larson Pre-algebra: Student Edition...AlgebraISBN:9780547587776Author:HOLT MCDOUGALPublisher:HOLT MCDOUGAL
 Big Ideas Math A Bridge To Success Algebra 1: Stu...AlgebraISBN:9781680331141Author:HOUGHTON MIFFLIN HARCOURTPublisher:Houghton Mifflin Harcourt
 Functions and Change: A Modeling Approach to Coll...AlgebraISBN:9781337111348Author:Bruce Crauder, Benny Evans, Alan NoellPublisher:Cengage Learning
Glencoe Algebra 1, Student Edition, 9780079039897...
Algebra
ISBN:9780079039897
Author:Carter
Publisher:McGraw Hill
Holt Mcdougal Larson Pre-algebra: Student Edition...
Algebra
ISBN:9780547587776
Author:HOLT MCDOUGAL
Publisher:HOLT MCDOUGAL
Big Ideas Math A Bridge To Success Algebra 1: Stu...
Algebra
ISBN:9781680331141
Author:HOUGHTON MIFFLIN HARCOURT
Publisher:Houghton Mifflin Harcourt
Functions and Change: A Modeling Approach to Coll...
Algebra
ISBN:9781337111348
Author:Bruce Crauder, Benny Evans, Alan Noell
Publisher:Cengage Learning
The Shape of Data: Distributions: Crash Course Statistics #7; Author: CrashCourse;https://www.youtube.com/watch?v=bPFNxD3Yg6U;License: Standard YouTube License, CC-BY
Shape, Center, and Spread - Module 20.2 (Part 1); Author: Mrmathblog;https://www.youtube.com/watch?v=COaid7O_Gag;License: Standard YouTube License, CC-BY
Shape, Center and Spread; Author: Emily Murdock;https://www.youtube.com/watch?v=_YyW0DSCzpM;License: Standard Youtube License