
Statistics: The Art and Science of Learning from Data (4th Edition)
4th Edition
ISBN: 9780321997838
Author: Alan Agresti, Christine A. Franklin, Bernhard Klingenberg
Publisher: PEARSON
expand_more
expand_more
format_list_bulleted
Concept explainers
Videos
Textbook Question
Chapter 12.4, Problem 45PB
Predicting clothes purchases For a random sample of children from a school district in South Carolina, a
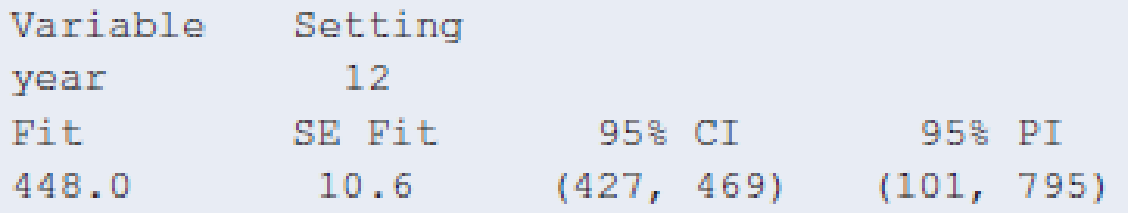
- a. Interpret the value listed under “Fit.”
- b. Interpret the interval listed under “95% CI.”
- c. Interpret the interval listed under “95% PI.”
Expert Solution & Answer
Want to see the full answer?
Check out a sample textbook solution
Students have asked these similar questions
く
Chapter 5-Section 1 Homework X
MindTap - Cengage Learning
x +
C
webassign.net/web/Student/Assignment-Responses/submit?pos=3&dep=36701632&tags=autosave #question3874894_3
M Gmail
品
YouTube
Maps
5. [-/20 Points]
DETAILS
MY NOTES
BBUNDERSTAT12 5.1.020.
☆
B
Verify it's you
Finish update:
All Bookmarks
PRACTICE ANOTHER
A computer repair shop has two work centers. The first center examines the computer to see what is wrong, and the second center repairs the computer. Let x₁ and x2 be
random variables representing the lengths of time in minutes to examine a computer (✗₁) and to repair a computer (x2). Assume x and x, are independent random variables.
Long-term history has shown the following times.
01
Examine computer, x₁₁ = 29.6 minutes; σ₁ = 8.1 minutes
Repair computer, X2: μ₂ = 92.5 minutes; σ2 = 14.5 minutes
(a) Let W = x₁ + x2 be a random variable representing the total time to examine and repair the computer. Compute the mean, variance, and standard deviation of W.
(Round your answers…
The acidity or alkalinity of a solution is measured using pH. A pH less than 7 is acidic; a pH greater than 7 is alkaline. The accompanying data represent the pH in samples of bottled water and tap
water. Complete parts (a) and (b).
Click the icon to view the data table.
(a) Determine the mean, median, and mode pH for each type of water. Comment on the differences between the two water types.
Select the correct choice below and fill in any answer boxes in your choice.
A. For tap water, the mean pH is
(Round to three decimal places as needed.)
B. The mean does not exist.
Data table
Тар
Bottled
7.64 7.45 7.46 7.50 7.68
7.45 7.10 7.56 7.46 7.52
5.15 5.09 5.31 5.20 4.78
5.52 5.31 5.13 5.31 5.21
7.69
7.46
5.23
5.24
Print
Done
-
☑
The median for the given set of six ordered data values is 29.5.
9 12 23 41 49
What is the missing value?
The missing value is ☐.
Chapter 12 Solutions
Statistics: The Art and Science of Learning from Data (4th Edition)
Ch. 12.1 - Car mileage and weight The Car Weight and Mileage...Ch. 12.1 - Prob. 2PBCh. 12.1 - Predicting maximum bench strength in males For the...Ch. 12.1 - Prob. 4PBCh. 12.1 - Mu, not y For a population regression equation,...Ch. 12.1 - Prob. 6PBCh. 12.1 - Study time and college GPA Exercise 3.39 in...Ch. 12.1 - Prob. 8PBCh. 12.1 - Cell phone specs Refer to the cell phone data set...Ch. 12.1 - Prob. 10PB
Ch. 12.2 - t-score? A regression analysis is conducted with...Ch. 12.2 - Prob. 12PBCh. 12.2 - Confidence interval for slope Refer to the...Ch. 12.2 - Prob. 14PBCh. 12.2 - Strength through leg press The high school female...Ch. 12.2 - Prob. 16PBCh. 12.2 - More girls are good? Repeat the previous exercise...Ch. 12.2 - CI and two-sided tests correspond Refer to the...Ch. 12.2 - Advertising and sales Each month, the owner of Caf...Ch. 12.2 - Prob. 20PBCh. 12.2 - GPA and skipping classrevisited Refer to the...Ch. 12.2 - Prob. 22PBCh. 12.3 - Dollars and thousands of dollars If a slope is...Ch. 12.3 - Prob. 24PBCh. 12.3 - Sketch scatterplot Sketch a scatterplot,...Ch. 12.3 - Prob. 26PBCh. 12.3 - Body fat For the Male Athlete Strength data file...Ch. 12.3 - Prob. 28PBCh. 12.3 - SAT regression toward mean Refer to the previous...Ch. 12.3 - Prob. 30PBCh. 12.3 - GPA and study time Refer to the association you...Ch. 12.3 - Prob. 32PBCh. 12.3 - Does tutoring help? For a class of 100 students,...Ch. 12.3 - Prob. 34PBCh. 12.3 - Golf regression In the first round of a golf...Ch. 12.3 - Prob. 36PBCh. 12.3 - Food and drink sales The owner of Berthas...Ch. 12.3 - Prob. 38PBCh. 12.3 - Violent crime and single-parent families Use...Ch. 12.4 - Poor predicted strengths The MINITAB output shows...Ch. 12.4 - Prob. 42PBCh. 12.4 - Bench press residuals The figure is a histogram of...Ch. 12.4 - Predicting house prices The House Selling Prices...Ch. 12.4 - Predicting clothes purchases For a random sample...Ch. 12.4 - Prob. 46PBCh. 12.4 - ANOVA table for leg press Exercise 12.15 referred...Ch. 12.4 - Prob. 48PBCh. 12.4 - Variability and F Refer to the previous two...Ch. 12.4 - Understanding an ANOVA table For a random sample...Ch. 12.4 - Predicting cell phone weight Refer to the cell...Ch. 12.4 - Cell phone ANOVA Report the ANOVA table for the...Ch. 12.5 - Savings grow exponentially You invest 100 in a...Ch. 12.5 - Prob. 55PBCh. 12.5 - Prob. 56PBCh. 12.5 - Prob. 57PBCh. 12.5 - Prob. 58PBCh. 12.5 - Prob. 59PBCh. 12.5 - Prob. 60PBCh. 12.5 - Prob. 61PBCh. 12 - Prob. 62CPCh. 12 - Prob. 63CPCh. 12 - Prob. 64CPCh. 12 - Prob. 65CPCh. 12 - Prob. 66CPCh. 12 - Prob. 67CPCh. 12 - Prob. 68CPCh. 12 - Prob. 69CPCh. 12 - Prob. 70CPCh. 12 - Prob. 71CPCh. 12 - Prob. 72CPCh. 12 - Prob. 73CPCh. 12 - Prob. 74CPCh. 12 - World population growth The table shows the world...Ch. 12 - Prob. 76CPCh. 12 - Prob. 77CPCh. 12 - Prob. 78CPCh. 12 - Prob. 79CPCh. 12 - Prob. 81CPCh. 12 - Prob. 82CPCh. 12 - Prob. 83CPCh. 12 - Prob. 84CPCh. 12 - Prob. 85CPCh. 12 - Prob. 86CPCh. 12 - Prob. 87CPCh. 12 - Prob. 88CPCh. 12 - Prob. 89CPCh. 12 - Assumptions What assumptions are needed to use the...Ch. 12 - Assumptions fail? Refer to the previous exercise....Ch. 12 - Lots of standard deviations Explain carefully the...Ch. 12 - Decrease in home values A Freddie Mac quarterly...Ch. 12 - Population growth Exercise 12.57 about U.S....Ch. 12 - Multiple choice: Interpret r One can interpret r =...Ch. 12 - Multiple choice: Correlation invalid The...Ch. 12 - Multiple choice: Slope and correlation The slope...Ch. 12 - Multiple choice: Regress x on y The regression of...Ch. 12 - Multiple choice: Income and height University of...Ch. 12 - True or false The variables y = annual income...Ch. 12 - Prob. 101CPCh. 12 - Why is there regression toward the mean? Refer to...Ch. 12 - Prob. 103CPCh. 12 - Prob. 104CPCh. 12 - Prob. 105CPCh. 12 - Prob. 106CP
Knowledge Booster


Learn more about
Need a deep-dive on the concept behind this application? Look no further. Learn more about this topic, statistics and related others by exploring similar questions and additional content below.Similar questions
- Find the population mean or sample mean as indicated. Sample: 22, 18, 9, 6, 15 □ Select the correct choice below and fill in the answer box to complete your choice. O A. x= B. μεarrow_forwardWhy the correct answer is letter A? Students in an online course are each randomly assigned to receive either standard practice exercises or adaptivepractice exercises. For the adaptive practice exercises, the next question asked is determined by whether the studentgot the previous question correct. The teacher of the course wants to determine whether there is a differencebetween the two practice exercise types by comparing the proportion of students who pass the course from eachgroup. The teacher plans to test the null hypothesis that versus the alternative hypothesis , whererepresents the proportion of students who would pass the course using standard practice exercises andrepresents the proportion of students who would pass the course using adaptive practice exercises.The teacher knows that the percent confidence interval for the difference in proportion of students passing thecourse for the two practice exercise types (standard minus adaptive) is and the percent…arrow_forwardCarpetland salespersons average $8,000 per week in sales. Steve Contois, the firm's vice president, proposes a compensation plan with new selling incentives. Steve hopes that the results of a trial selling period will enable him to conclude that the compensation plan increases the average sales per salesperson. a. Develop the appropriate null and alternative hypotheses.H 0: H a:arrow_forward
- توليد تمرين شامل حول الانحدار الخطي المتعدد بطريقة المربعات الصغرىarrow_forwardThe U.S. Postal Service will ship a Priority Mail® Large Flat Rate Box (12" 3 12" 3 5½") any where in the United States for a fixed price, regardless of weight. The weights (ounces) of 20 ran domly chosen boxes are shown below. (a) Make a stem-and-leaf diagram. (b) Make a histogram. (c) Describe the shape of the distribution. Weights 72 86 28 67 64 65 45 86 31 32 39 92 90 91 84 62 80 74 63 86arrow_forward(a) What is a bimodal histogram? (b) Explain the difference between left-skewed, symmetric, and right-skewed histograms. (c) What is an outlierarrow_forward
- (a) Test the hypothesis. Consider the hypothesis test Ho = : against H₁o < 02. Suppose that the sample sizes aren₁ = 7 and n₂ = 13 and that $² = 22.4 and $22 = 28.2. Use α = 0.05. Ho is not ✓ rejected. 9-9 IV (b) Find a 95% confidence interval on of 102. Round your answer to two decimal places (e.g. 98.76).arrow_forwardLet us suppose we have some article reported on a study of potential sources of injury to equine veterinarians conducted at a university veterinary hospital. Forces on the hand were measured for several common activities that veterinarians engage in when examining or treating horses. We will consider the forces on the hands for two tasks, lifting and using ultrasound. Assume that both sample sizes are 6, the sample mean force for lifting was 6.2 pounds with standard deviation 1.5 pounds, and the sample mean force for using ultrasound was 6.4 pounds with standard deviation 0.3 pounds. Assume that the standard deviations are known. Suppose that you wanted to detect a true difference in mean force of 0.25 pounds on the hands for these two activities. Under the null hypothesis, 40 = 0. What level of type II error would you recommend here? Round your answer to four decimal places (e.g. 98.7654). Use a = 0.05. β = i What sample size would be required? Assume the sample sizes are to be equal.…arrow_forward= Consider the hypothesis test Ho: μ₁ = μ₂ against H₁ μ₁ μ2. Suppose that sample sizes are n₁ = 15 and n₂ = 15, that x1 = 4.7 and X2 = 7.8 and that s² = 4 and s² = 6.26. Assume that o and that the data are drawn from normal distributions. Use απ 0.05. (a) Test the hypothesis and find the P-value. (b) What is the power of the test in part (a) for a true difference in means of 3? (c) Assuming equal sample sizes, what sample size should be used to obtain ẞ = 0.05 if the true difference in means is - 2? Assume that α = 0.05. (a) The null hypothesis is 98.7654). rejected. The P-value is 0.0008 (b) The power is 0.94 . Round your answer to four decimal places (e.g. Round your answer to two decimal places (e.g. 98.76). (c) n₁ = n2 = 1 . Round your answer to the nearest integer.arrow_forward
- Consider the hypothesis test Ho: = 622 against H₁: 6 > 62. Suppose that the sample sizes are n₁ = 20 and n₂ = 8, and that = 4.5; s=2.3. Use a = 0.01. (a) Test the hypothesis. Round your answers to two decimal places (e.g. 98.76). The test statistic is fo = i The critical value is f = Conclusion: i the null hypothesis at a = 0.01. (b) Construct the confidence interval on 02/022 which can be used to test the hypothesis: (Round your answer to two decimal places (e.g. 98.76).) iarrow_forward2011 listing by carmax of the ages and prices of various corollas in a ceratin regionarrow_forwardس 11/ أ . اذا كانت 1 + x) = 2 x 3 + 2 x 2 + x) هي متعددة حدود محسوبة باستخدام طريقة الفروقات المنتهية (finite differences) من جدول البيانات التالي للدالة (f(x . احسب قيمة . ( 2 درجة ) xi k=0 k=1 k=2 k=3 0 3 1 2 2 2 3 αarrow_forward
arrow_back_ios
SEE MORE QUESTIONS
arrow_forward_ios
Recommended textbooks for you

 Trigonometry (MindTap Course List)TrigonometryISBN:9781337278461Author:Ron LarsonPublisher:Cengage Learning
 Glencoe Algebra 1, Student Edition, 9780079039897...AlgebraISBN:9780079039897Author:CarterPublisher:McGraw Hill
 Big Ideas Math A Bridge To Success Algebra 1: Stu...AlgebraISBN:9781680331141Author:HOUGHTON MIFFLIN HARCOURTPublisher:Houghton Mifflin Harcourt
 College Algebra (MindTap Course List)AlgebraISBN:9781305652231Author:R. David Gustafson, Jeff HughesPublisher:Cengage Learning
 Functions and Change: A Modeling Approach to Coll...AlgebraISBN:9781337111348Author:Bruce Crauder, Benny Evans, Alan NoellPublisher:Cengage Learning
Trigonometry (MindTap Course List)
Trigonometry
ISBN:9781337278461
Author:Ron Larson
Publisher:Cengage Learning
Glencoe Algebra 1, Student Edition, 9780079039897...
Algebra
ISBN:9780079039897
Author:Carter
Publisher:McGraw Hill
Big Ideas Math A Bridge To Success Algebra 1: Stu...
Algebra
ISBN:9781680331141
Author:HOUGHTON MIFFLIN HARCOURT
Publisher:Houghton Mifflin Harcourt
College Algebra (MindTap Course List)
Algebra
ISBN:9781305652231
Author:R. David Gustafson, Jeff Hughes
Publisher:Cengage Learning
Functions and Change: A Modeling Approach to Coll...
Algebra
ISBN:9781337111348
Author:Bruce Crauder, Benny Evans, Alan Noell
Publisher:Cengage Learning
Correlation Vs Regression: Difference Between them with definition & Comparison Chart; Author: Key Differences;https://www.youtube.com/watch?v=Ou2QGSJVd0U;License: Standard YouTube License, CC-BY
Correlation and Regression: Concepts with Illustrative examples; Author: LEARN & APPLY : Lean and Six Sigma;https://www.youtube.com/watch?v=xTpHD5WLuoA;License: Standard YouTube License, CC-BY