
Videos
Height and Weight Distribution The chart shown below uses the symbol σ to represent the standard deviation. Note that 2σ represents the value that is two standard deviations above the mean −2σ represents the value that is two standard deviations below the mean. The unshaded areas, from two standard deviations below the mean to two standard deviations above the mean, are considered the normal range. For example, the average (mean) 8-year-old boy has a height of about 50 inches, but any heights between approximately 45 inches and 55 inches are considered normal for 8-year-old boys. Refer to the chart at the bottom of the previous column to answer the following questions.
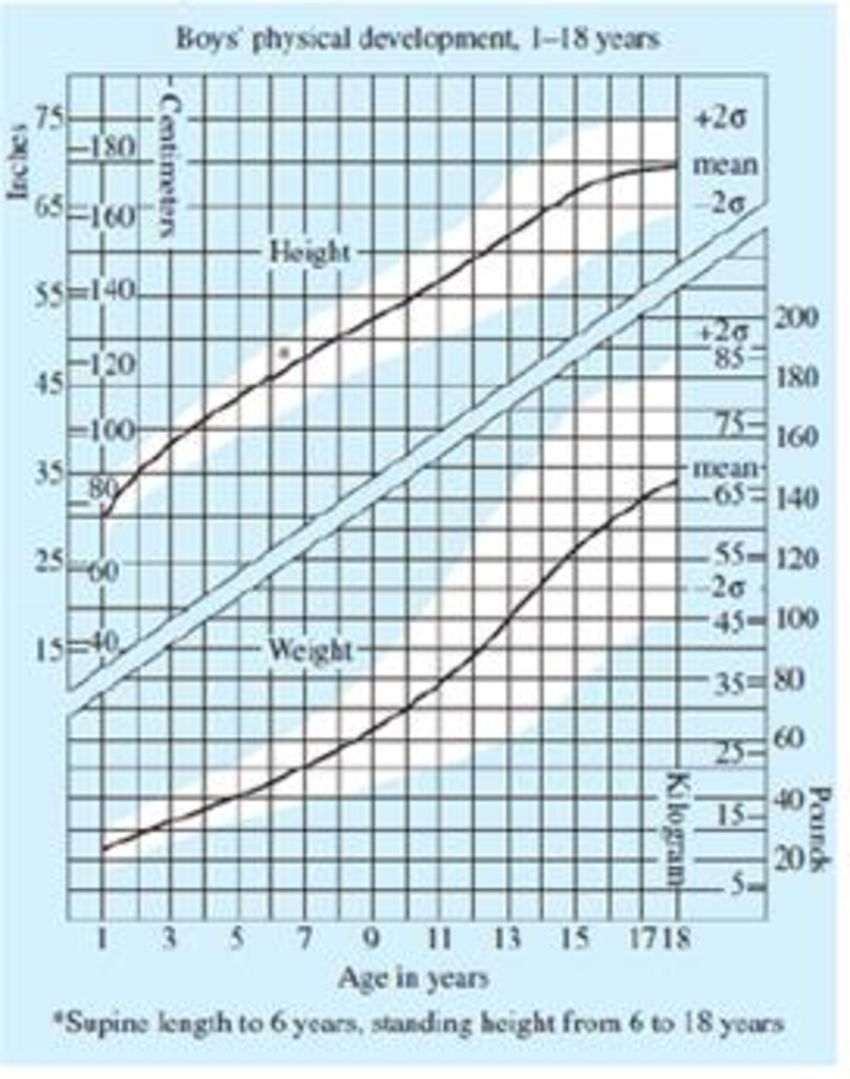
- a. What happens to the standard deviation for weights of boys as the age of boys increases? What is the significance of this fact?
- b. Determine the mean weight and normal range for boys at age 13.
- c. Determine the mean height and normal range for boys at age 13.
- d. At age 17, what is the mean weight, in pounds, of boys?
- e. Vi/hat is the approximate standard deviation of boys' weights at age 17?
- f. Assuming that this chart was constructed so that approximately 95% of all boys are always in the normal range, determine what percentage of boys are not in the normal range.

Trending nowThis is a popular solution!

Chapter 12 Solutions
Books a la carte edition for A Survey of Mathematics with Applications (10th Edition)


- If the average price of a new one family home is $246,300 with a standard deviation of $15,000 find the minimum and maximum prices of the houses that a contractor will build to satisfy 88% of the market valuearrow_forwardT={(−7,1),(1,−1),(6,−8),(2,8)} Find the domain and range of the inverse. Express your answer as a set of numbers.arrow_forwardT={(−7,1),(1,−1),(6,−8),(2,8)}. Find the inverse. Express your answer as a set of ordered pairs.arrow_forward
- Starting with the finished version of Example 6.2, attached, change the decision criterion to "maximize expected utility," using an exponential utility function with risk tolerance $5,000,000. Display certainty equivalents on the tree. a. Keep doubling the risk tolerance until the company's best strategy is the same as with the EMV criterion—continue with development and then market if successful. The risk tolerance must reach $ 160,000,000 before the risk averse company acts the same as the EMV-maximizing company. b. With a risk tolerance of $320,000,000, the company views the optimal strategy as equivalent to receiving a sure $____________ , even though the EMV from the original strategy (with no risk tolerance) is $ 59,200.arrow_forwardComplete solutions need handwriting. For all only sure experts solve it correct complete solutionsarrow_forwardThe graph below shows the U.S. federal expenses for 2012. A) estimate the fraction of the total expenses that were spent on Medicare. Write your answer as the closest fraction whose denominator is 100. B) estimate the fraction of the total expenses that were spent on Medicare and Medicaid. Write your answer as the closest fraction, whose denominator is 100.arrow_forward
- Starting with the finished version of Example 6.2, attached, change the decision criterion to "maximize expected utility," using an exponential utility function with risk tolerance $5,000,000. Display certainty equivalents on the tree. a. Keep doubling the risk tolerance until the company's best strategy is the same as with the EMV criterion—continue with development and then market if successful. The risk tolerance must reach $ ____________ before the risk averse company acts the same as the EMV-maximizing company. b. With a risk tolerance of $320,000,000, the company views the optimal strategy as equivalent to receiving a sure $____________ , even though the EMV from the original strategy (with no risk tolerance) is $ ___________ .arrow_forward2.8.1arrow_forwardDo not use the Residue Theorem. Thank you.arrow_forward
- A television network earns an average of $14 million each season from a hit program and loses an average of $8 million each season on a program that turns out to be a flop. Of all programs picked up by this network in recent years, 25% turn out to be hits and 75% turn out to be flops. At a cost of C dollars, a market research firm will analyze a pilot episode of a prospective program and issue a report predicting whether the given program will end up being a hit. If the program is actually going to be a hit, there is a 75% chance that the market researchers will predict the program to be a hit. If the program is actually going to be a flop, there is only a 30% chance that the market researchers will predict the program to be a hit. What is the maximum value of C that the network should be willing to pay the market research firm? Enter your answer in dollars, not in million dollars. $ __________ Calculate EVPI for this decision problem. Enter your answer in dollars, not in million…arrow_forwardEvaluate the line integral sin z dz, So sin where C is the portion of the curve y = x² from 0 to −1 + i.arrow_forwardLet f(z) be complex differentiable everywhere in C. Fix two distinct complex numbers a and b and a circle C of radius R with |a| < R,|b| < R traversed in the counter-clockwise direction. Evaluate the integral Sc − f(z)dz (z - a)(z – b) in terms of a, b and the values of f at those points.arrow_forward
 Big Ideas Math A Bridge To Success Algebra 1: Stu...AlgebraISBN:9781680331141Author:HOUGHTON MIFFLIN HARCOURTPublisher:Houghton Mifflin Harcourt
 Glencoe Algebra 1, Student Edition, 9780079039897...AlgebraISBN:9780079039897Author:CarterPublisher:McGraw Hill
 Holt Mcdougal Larson Pre-algebra: Student Edition...AlgebraISBN:9780547587776Author:HOLT MCDOUGALPublisher:HOLT MCDOUGAL
 College Algebra (MindTap Course List)AlgebraISBN:9781305652231Author:R. David Gustafson, Jeff HughesPublisher:Cengage Learning