Thinking Mathematically (6th Edition)
6th Edition
ISBN: 9780321867322
Author: Robert F. Blitzer
Publisher: PEARSON
expand_more
expand_more
format_list_bulleted
Concept explainers
Videos
Textbook Question
Chapter 12.4, Problem 15E
Not everyone pays the same price for the same model of a car. The figure illustrates a
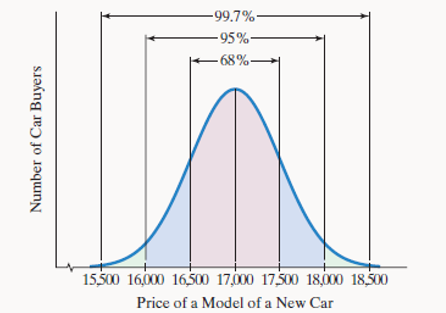
In Exercises 11-22, use the 68-95-99.7 Rule, illustrated in the figure, to find the percentage of buyers who paid
between $16,000 and $17000.
Expert Solution & Answer
Want to see the full answer?
Check out a sample textbook solution
Students have asked these similar questions
Q3
3 Points
1 0 2
4
0 6
01 5
-
-1
0
10
00 0
0
1 1
The reduced row echelon form of the augmented matrix of a linear system is given above.
Describe the solution set of this linear system in parametric vector form.
Please select file(s) Select file(s)
Save Answer
3. Suppose you have 12 professors in a department and you have to chose members of departmental
committees.
(a) How many ways can you pick members for one 4 people committee?
(b) How many ways can you pick members for two different 4 people committees if no-one can serve
on both committees?
(c) How many ways can you pick members for two different 4 people committees if people can serve
on both committees?
(d) How about if you need members for a 4 person, a 5 person, and a 3 person committee, people
cannot serve on more than one committee?
(e) How about if you need members for a 4 person, a 5 person, and a 3 person committee, people can
serve on more than one committee?
(f) How about if you need members for a 4 person, a 5 person, and a 3 person committee, people
cannot serve on more than one committee, and the first person chosen for each committee serves
as chair?
Peggy conducted a study to identify the randomness of rainy days in fall. For 15 days, she recorded whether it rained that day or not. They denoted a rainy day with the letter R, a day without rain with the letter N.
R N N R R N N R R N N R R R R
Test the sequence for randomness. Use .
Chapter 12 Solutions
Thinking Mathematically (6th Edition)
Ch. 12.1 - CHECK POINT 1 A city government wants to conduct a...Ch. 12.1 - CHECK POINT 2 Explain why the sampling technique...Ch. 12.1 - CHECK POINT 3 Construct a frequency distribution...Ch. 12.1 - CHECK POINT 4 Use the classes in Table 12.3 to...Ch. 12.1 - CHECKPOINTS 5 Construct a stem-and-leaf plot for...Ch. 12.1 - A sample obtained in such a way that every member...Ch. 12.1 - Prob. 2CVCCh. 12.1 - Fill in each blank so that the resulting statement...Ch. 12.1 - 4. Data can be displayed using a bar graph with...Ch. 12.1 - Prob. 5CVC
Ch. 12.1 - A data presentation that separates each data item...Ch. 12.1 - In Exercises 7-10, determine whether each...Ch. 12.1 - Prob. 8CVCCh. 12.1 - In Exercises 7-10, determine whether each...Ch. 12.1 - Fill in each blank so that the resulting statement...Ch. 12.1 - 1. The government of a large city needs to...Ch. 12.1 - The city council of a large city needs to know...Ch. 12.1 - A questionnaire was given to students in an...Ch. 12.1 - A questionnaire was given to students in an...Ch. 12.1 - A questionnaire was given to students in an...Ch. 12.1 - A questionnaire was given to students in an...Ch. 12.1 - 7. A random sample of 30 college students is...Ch. 12.1 - 8. A random sample of 30 male college students is...Ch. 12.1 - A college professor had students keep a diary of...Ch. 12.1 - A college professor had students keep a diary of...Ch. 12.1 - A college professor had students keep a diary of...Ch. 12.1 - A college professor had students keep a diary of...Ch. 12.1 - A college professor had students keep a diary of...Ch. 12.1 - A college professor had students keep a diary of...Ch. 12.1 - A college professor had students keep a diary of...Ch. 12.1 - A college professor had students keep a diary of...Ch. 12.1 - 17. As of 2011, the following are the ages, in...Ch. 12.1 - The IQ scores of 70 students enrolled in a liberal...Ch. 12.1 - Construct a histogram and a frequency polygon for...Ch. 12.1 - 20. Construct a histogram and a frequency polygon...Ch. 12.1 - 21. Construct a histogram and a frequency polygon...Ch. 12.1 - In Exercises 22-25, determine whether each...Ch. 12.1 - In Exercises 22-25, determine whether each...Ch. 12.1 - In Exercises 22-25, determine whether each...Ch. 12.1 - In Exercises 22-25, determine whether each...Ch. 12.1 - The frequency polygon shows a distribution of IQ...Ch. 12.1 - The frequency polygon shows a distribution of IQ...Ch. 12.1 - The frequency polygon shows a distribution of IQ...Ch. 12.1 - The frequency polygon shows a distribution of IQ...Ch. 12.1 - 30. Construct a stem-and-leaf plot for the data in...Ch. 12.1 - 31. A random sample of 40 college professors is...Ch. 12.1 - In "Ages of Oscar-Winning Best Actors and...Ch. 12.1 - Prob. 33ECh. 12.1 - Prob. 34ECh. 12.1 - Prob. 35ECh. 12.1 - In Exercises 33-37, describe what is misleading in...Ch. 12.1 - In Exercises 33-37, describe what is misleading in...Ch. 12.1 - What is a population? What is a sample?Ch. 12.1 - Prob. 39ECh. 12.1 - 40. Suppose you are interested in whether or not...Ch. 12.1 - For Exercise 40, would questioning every fifth...Ch. 12.1 - What is a frequency distribution?Ch. 12.1 - What is a histogram?Ch. 12.1 - What is a frequency polygon?Ch. 12.1 - 45. Describe how to construct a frequency polygon...Ch. 12.1 - Prob. 46ECh. 12.1 - Prob. 47ECh. 12.1 - Make Sense? In Exercises 48-51, determine whether...Ch. 12.1 - Make Sense? In Exercises 48-51, determine whether...Ch. 12.1 - Make Sense? In Exercises 48-51, determine whether...Ch. 12.1 - Make Sense? In Exercises 48-51, determine whether...Ch. 12.1 - 52. Construct a grouped frequency distribution for...Ch. 12.1 - The classic book on distortion using statistics is...Ch. 12.1 - 54. Each group member should find one example of a...Ch. 12.2 - CHECKPOINT I Use Table 12.6 to find the mean...Ch. 12.2 - $$ CHECK POINT 2 Find the mean, $$, for the data...Ch. 12.2 - CHECK POINT 3 Find the median for each of the...Ch. 12.2 - CHECK POINT 4 Find the median for the following...Ch. 12.2 - CHECK POINT 5 Arrange the data items for eating in...Ch. 12.2 - CHECK POINT 6 Find the median for the following...Ch. 12.2 - Prob. 7CPCh. 12.2 - CHECK POINT 8 Find the mode for each of the...Ch. 12.2 - CHECK POINT 9 Use Table 12.12 on the previous page...Ch. 12.2 - CHECK POINT 10 Consumer Reports magazine gave the...Ch. 12.2 - 1. the sum of all the data items divided by the...Ch. 12.2 - 2. The measure of central tendency that is the...Ch. 12.2 - Prob. 3CVCCh. 12.2 - Prob. 4CVCCh. 12.2 - Prob. 5CVCCh. 12.2 - In Exercises 6-9, determine whether each statement...Ch. 12.2 - Prob. 7CVCCh. 12.2 - In Exercises 6-9, determine whether each statement...Ch. 12.2 - In Exercises 6-9, determine whether each statement...Ch. 12.2 - In Exercises 1-8, find the mean for each group of...Ch. 12.2 - In Exercises 1-8, find the mean for each group of...Ch. 12.2 - Prob. 3ECh. 12.2 - In Exercises 1-8, find the mean for each group of...Ch. 12.2 - In Exercises 1-8, find the mean for each group of...Ch. 12.2 - In Exercises 1-8, find the mean for each group of...Ch. 12.2 - Prob. 7ECh. 12.2 - In Exercises 1-8, find the mean for each group of...Ch. 12.2 - In Exercises 9-12, find the mean for the data...Ch. 12.2 - In Exercises 9-12, find the mean for the data...Ch. 12.2 - In Exercises 9-12, find the mean for the data...Ch. 12.2 - In Exercises 9-12, find the mean for the data...Ch. 12.2 - In Exercises 13-20, find the median for each group...Ch. 12.2 - In Exercises 13-20, find the median for each group...Ch. 12.2 - In Exercises 13-20, find the median for each group...Ch. 12.2 - In Exercises 13-20, find the median for each group...Ch. 12.2 - In Exercises 13-20, find the median for each group...Ch. 12.2 - Prob. 18ECh. 12.2 - In Exercises 13-20, find the median for each group...Ch. 12.2 - In Exercises 13-20, find the median for each group...Ch. 12.2 - Find the median for the data items in the...Ch. 12.2 - Prob. 22ECh. 12.2 - Find the median for the data items in the...Ch. 12.2 - Find the median for the data items in the...Ch. 12.2 - In Exercises 25-32, find the mode for each group...Ch. 12.2 - Prob. 26ECh. 12.2 - In Exercises 25-32, find the mode for each group...Ch. 12.2 - In Exercises 25-32, find the mode for each group...Ch. 12.2 - In Exercises 25-32, find the mode for each group...Ch. 12.2 - In Exercises 25-32, find the mode for each group...Ch. 12.2 - In Exercises 25-32, find the mode for each group...Ch. 12.2 - In Exercises 25-32, find the mode for each group...Ch. 12.2 - Prob. 33ECh. 12.2 - Find the mode for the data items in the frequency...Ch. 12.2 - Prob. 35ECh. 12.2 - Find the mode for the data items in the frequency...Ch. 12.2 - In Exercises 37-44, find the midrange for each...Ch. 12.2 - Prob. 38ECh. 12.2 - In Exercises 37-44, find the midrange for each...Ch. 12.2 - In Exercises 37-44, find the midrange for each...Ch. 12.2 - In Exercises 37-44, find the midrange for each...Ch. 12.2 - Prob. 42ECh. 12.2 - Prob. 43ECh. 12.2 - In Exercises 37-44, find the midrange for each...Ch. 12.2 - Prob. 45ECh. 12.2 - Prob. 46ECh. 12.2 - Find the midrange for the data items in the...Ch. 12.2 - Find the midrange for the data items in the...Ch. 12.2 - In Exercises 49-54, use each display of data items...Ch. 12.2 - In Exercises 49-54, use each display of data items...Ch. 12.2 - In Exercises 49-54, use each display of data items...Ch. 12.2 - In Exercises 49-54, use each display of data items...Ch. 12.2 - Prob. 53ECh. 12.2 - In Exercises 49-54, use each display of data items...Ch. 12.2 - Prob. 55ECh. 12.2 - Exercises 55-57 present data on a variety of...Ch. 12.2 - Prob. 57ECh. 12.2 - The weights (to the nearest five pounds) of 40...Ch. 12.2 - Prob. 59ECh. 12.2 - The weights (to the nearest five pounds) of 40...Ch. 12.2 - The weights (to the nearest five pounds) of 40...Ch. 12.2 - 62. An advertisement for a speed-reading course...Ch. 12.2 - Prob. 63ECh. 12.2 - 64. What is the mean and how is it obtained?
Ch. 12.2 - Prob. 65ECh. 12.2 - Prob. 66ECh. 12.2 - Prob. 67ECh. 12.2 - 68. The "average" income in the United States can...Ch. 12.2 - Prob. 69ECh. 12.2 - Prob. 70ECh. 12.2 - A student's parents promise to pay for next...Ch. 12.2 - According to the National Oceanic and Atmospheric...Ch. 12.2 - Prob. 73ECh. 12.2 - Make Sense? In Exercises 73-76, determine whether...Ch. 12.2 - Prob. 75ECh. 12.2 - Make Sense? Exercises 73-76, determine whether...Ch. 12.2 - Prob. 77ECh. 12.2 - On an examination given to 30 students, no student...Ch. 12.2 - Select a characteristic, such as shoe size or...Ch. 12.2 - A book on spotting bad statistics and learning to...Ch. 12.3 - CHECKPOINT 1 Find the range for the following...Ch. 12.3 - CHECK POINT 2 Compute the mean for the following...Ch. 12.3 - CHECK POINT 3 Find the standard deviation for the...Ch. 12.3 - CHECK POINT 4 Find the standard deviation of the...Ch. 12.3 - CHECK POINT 5 Shown below are the means and...Ch. 12.3 - Fill in each blank so that the resulting statement...Ch. 12.3 - Fill in each blank so that the resulting statement...Ch. 12.3 - Fill in each blank so that the resulting statement...Ch. 12.3 - Fill in each blank so that the resulting statement...Ch. 12.3 - Fill in each blank so that the resulting statement...Ch. 12.3 - In Exercises 1-6, find the range for each group of...Ch. 12.3 - In Exercises 1-6, find the range for each group of...Ch. 12.3 - In Exercises 1-6, find the range for each group of...Ch. 12.3 - In Exercises 1-6, find the range for each group of...Ch. 12.3 - In Exercises 1-6, find the range for each group of...Ch. 12.3 - Prob. 6ECh. 12.3 - In Exercises 7-10, a group of data items and their...Ch. 12.3 - In Exercises 7-10, a group of data items and their...Ch. 12.3 - In Exercises 7-10, a group of data items and their...Ch. 12.3 - Prob. 10ECh. 12.3 - In Exercises 11-16, find a. the mean; b. the...Ch. 12.3 - In Exercises 11-16, find a. the mean; b. the...Ch. 12.3 - Prob. 13ECh. 12.3 - Prob. 14ECh. 12.3 - In Exercises 11-16, find a. the mean; b. the...Ch. 12.3 - In Exercises 11-16, find a. the mean; b. the...Ch. 12.3 - In Exercises 17-26, find the standard deviation...Ch. 12.3 - Prob. 18ECh. 12.3 - Prob. 19ECh. 12.3 - In Exercises 17-26, find the standard deviation...Ch. 12.3 - In Exercises 17-26, find the standard deviation...Ch. 12.3 - In Exercises 17-26, find the standard deviation...Ch. 12.3 - Prob. 23ECh. 12.3 - In Exercises 17-26, find the standard deviation...Ch. 12.3 - Prob. 25ECh. 12.3 - In Exercises 17-26, find the standard deviation...Ch. 12.3 - In Exercises 27-28, compute the mean, range, and...Ch. 12.3 - In Exercises 27-28, compute the mean, range, and...Ch. 12.3 - In Exercises 29-36, use each display of data items...Ch. 12.3 - In Exercises 29-36, use each display of data items...Ch. 12.3 - In Exercises 29-36, use each display of data items...Ch. 12.3 - In Exercises 29-36, use each display of data items...Ch. 12.3 - In Exercises 29-36, use each display of data items...Ch. 12.3 - In Exercises 29-36, use each display of data items...Ch. 12.3 - Prob. 35ECh. 12.3 - In Exercises 29-36, use each display of data items...Ch. 12.3 - The data sets give the number of platinum albums...Ch. 12.3 - The data sets give the ages of the first six U.S....Ch. 12.3 - Describe how to find the range of a data set.Ch. 12.3 - Describe why the range might not be the best...Ch. 12.3 - Describe how the standard deviation is computed.Ch. 12.3 - 42. Describe what the standard deviation reveals...Ch. 12.3 - If a set of test scores has a standard deviation...Ch. 12.3 - Two classes took a statistics test. Both classes...Ch. 12.3 - Prob. 45ECh. 12.3 - Over a one-month period, stock A had a mean daily...Ch. 12.3 - Make Sense? Exercises 47-50, determine whether...Ch. 12.3 - Prob. 48ECh. 12.3 - Make Sense? In Exercises 47-50, determine whether...Ch. 12.3 - Make Sense? Exercises 47-50, determine whether...Ch. 12.3 - 51. Describe a situation in which a relatively...Ch. 12.3 - If a set of test scores has a large range but a...Ch. 12.3 - Prob. 53ECh. 12.3 - Use the data 0, 1, 3, 4, 4, 6. Add 2 to each of...Ch. 12.3 - Prob. 55ECh. 12.3 - 56. Group members should consult a current almanac...Ch. 12.4 - CHECK POINT 1 Female adult heights in North...Ch. 12.4 - CHECK POINT 2 Use the distribution of male adult...Ch. 12.4 - CHECK POINT 3 The length of horse pregnancies from...Ch. 12.4 - CHECK POINT 4 The SAT (Scholastic Aptitude Test)...Ch. 12.4 - CHECK POINT 5 Use the information in Example 5 to...Ch. 12.4 - CHECK POINT 6 A student scored in the 75th...Ch. 12.4 - CHECK POINI 7 A Harris Poll of 2513 US. adults...Ch. 12.4 - Prob. 1CVCCh. 12.4 - Prob. 2CVCCh. 12.4 - Fill in each blank so that the resulting statement...Ch. 12.4 - Prob. 4CVCCh. 12.4 - Prob. 5CVCCh. 12.4 - Prob. 6CVCCh. 12.4 - Prob. 7CVCCh. 12.4 - Prob. 8CVCCh. 12.4 - The scores on a test are normally distributed with...Ch. 12.4 - The scores on a test are normally distributed with...Ch. 12.4 - The scores on a test are normally distributed with...Ch. 12.4 - The scores on a test are normally distributed with...Ch. 12.4 - Prob. 5ECh. 12.4 - The scores on a test are normally distributed with...Ch. 12.4 - The scores on a test are normally distributed with...Ch. 12.4 - The scores on a test are normally distributed with...Ch. 12.4 - Prob. 9ECh. 12.4 - The scores on a test are normally distributed with...Ch. 12.4 - Not everyone pays the same price for the same...Ch. 12.4 - Not everyone pays the same price for the same...Ch. 12.4 - Not everyone pays the same price for the same...Ch. 12.4 - Not everyone pays the same price for the same...Ch. 12.4 - Not everyone pays the same price for the same...Ch. 12.4 - Not everyone pays the same price for the same...Ch. 12.4 - Not everyone pays the same price for the same...Ch. 12.4 - Prob. 18ECh. 12.4 - Not everyone pays the same price for the same...Ch. 12.4 - Not everyone pays the same price for the same...Ch. 12.4 - Not everyone pays the same price for the same...Ch. 12.4 - Prob. 22ECh. 12.4 - Intelligence quotients (IQs) on the Stanford-Binet...Ch. 12.4 - Intelligence quotients (IQs) on the Stanford-...Ch. 12.4 - Intelligence quotients (IQs) on the Stanford-...Ch. 12.4 - Intelligence quotients (IQs) on the Stanford-...Ch. 12.4 - Intelligence quotients (IQs) on the Stanford-Binet...Ch. 12.4 - Intelligence quotients (IQs) on the Stanford-Binet...Ch. 12.4 - Intelligence quotients (IQs) on the Stanford-...Ch. 12.4 - Intelligence quotients (IQs) on the Stanford-...Ch. 12.4 - Intelligence quotients (IQs) on the Stanford-...Ch. 12.4 - Intelligence quotients (IQs) on the Stanford-Binet...Ch. 12.4 - Prob. 33ECh. 12.4 - A set of data items is normally distributed with a...Ch. 12.4 - Prob. 35ECh. 12.4 - A set of data items is normally distributed with a...Ch. 12.4 - A set of data items is normally distributed with a...Ch. 12.4 - Prob. 38ECh. 12.4 - A set of data items is normally distributed with a...Ch. 12.4 - A set of data items is normally distributed with a...Ch. 12.4 - A set of data items is normally distributed with a...Ch. 12.4 - Prob. 42ECh. 12.4 - Prob. 43ECh. 12.4 - A set of data items is normally distributed with a...Ch. 12.4 - A set of data items is normally distributed with a...Ch. 12.4 - A set of data items is normally distributed with a...Ch. 12.4 - Prob. 47ECh. 12.4 - A set of data items is normally distributed with a...Ch. 12.4 - Scores on a denial anxiety scale range from 0 (no...Ch. 12.4 - Prob. 50ECh. 12.4 - Scores on a denial anxiety scale range from 0 (no...Ch. 12.4 - Scores on a denial anxiety scale range from 0 (no...Ch. 12.4 - Prob. 53ECh. 12.4 - Scores on a denial anxiety scale range from 0 (no...Ch. 12.4 - Prob. 55ECh. 12.4 - Scores on a denial anxiety scale range from 0 (no...Ch. 12.4 - Intelligence quotients on the Stanford-Binet...Ch. 12.4 - Prob. 58ECh. 12.4 - A set of data items is normally distributed with a...Ch. 12.4 - A set of data items is normally distributed with a...Ch. 12.4 - A set of data items is normally distributed with a...Ch. 12.4 - A set of data items is normally distributed with a...Ch. 12.4 - Prob. 63ECh. 12.4 - A set of data items is normally distributed with a...Ch. 12.4 - A set of data items is normally distributed with a...Ch. 12.4 - A set of data items is normally distributed with a...Ch. 12.4 - Reducing Gun Violence The data in the bar graph...Ch. 12.4 - How to Blow Your Job Interview The data in the bar...Ch. 12.4 - Prob. 69ECh. 12.4 - Using a random sample of 4000 TV households...Ch. 12.4 - 71. In 1997.Nielsen Media Research increased its...Ch. 12.4 - If Nielsen Media Research were to increase its...Ch. 12.4 - a. Is the shape of this distribution best...Ch. 12.4 - 74. a. Find the median murder rate per 100.000...Ch. 12.4 - 75. What is a symmetric histogram?
Ch. 12.4 - Prob. 76ECh. 12.4 - 77. Describe the 68-95-99.7 Rule.
Ch. 12.4 - Prob. 78ECh. 12.4 - What does a z-score measure?Ch. 12.4 - Prob. 80ECh. 12.4 - 81. Describe when a z-score is negative.
Ch. 12.4 - If you score in the 83rd percentile, what does...Ch. 12.4 - Prob. 83ECh. 12.4 - Prob. 84ECh. 12.4 - Prob. 85ECh. 12.4 - Give an example of a phenomenon that is not...Ch. 12.4 - Make Sense? In Exercises 87-90, determine whether...Ch. 12.4 - Make Sense? In Exercises 87-90, determine whether...Ch. 12.4 - Make sense? In Exercises 87-90, determine whether...Ch. 12.4 - Make Sense? In Exercises 87-90, determine whether...Ch. 12.5 - CHECK POINT I The distribution of monthly charges...Ch. 12.5 - CHECK POINT 2 Female adult heights in North...Ch. 12.5 - Prob. 3CPCh. 12.5 - Prob. 1CVCCh. 12.5 - Prob. 2CVCCh. 12.5 - Prob. 3CVCCh. 12.5 - Prob. 4CVCCh. 12.5 - Use the information shown below to fill in each...Ch. 12.5 - In Exercises 1-8, find the percentage of data...Ch. 12.5 - In Exercises 1-8, find the percentage of data...Ch. 12.5 - Prob. 3ECh. 12.5 - In Exercises 1-8, find the percentage of data...Ch. 12.5 - Prob. 5ECh. 12.5 - In Exercises 1-8, find the percentage of data...Ch. 12.5 - Prob. 7ECh. 12.5 - In Exercises 1-8, find the percentage of data...Ch. 12.5 - In Exercises 9-16, find the percentage of data...Ch. 12.5 - In Exercises 9-16, find the percentage of data...Ch. 12.5 - In Exercises 9-16, find the percentage of data...Ch. 12.5 - In Exercises 9-16, find the percentage of data...Ch. 12.5 - In Exercises 9-16, find the percentage of data...Ch. 12.5 - In Exercises 9-16, find the percentage of data...Ch. 12.5 - Prob. 15ECh. 12.5 - In Exercises 9-16, find the percentage of data...Ch. 12.5 - Systolic blood pressure readings are normally...Ch. 12.5 - Systolic blood pressure readings are normally...Ch. 12.5 - Systolic blood pressure readings are normally...Ch. 12.5 - Systolic blood pressure readings are normally...Ch. 12.5 - Systolic blood pressure readings are normally...Ch. 12.5 - Systolic blood pressure readings are normally...Ch. 12.5 - Prob. 23ECh. 12.5 - Systolic blood pressure readings are normally...Ch. 12.5 - Prob. 25ECh. 12.5 - Systolic blood pressure readings are normally...Ch. 12.5 - Prob. 27ECh. 12.5 - The weights for 12-month-old baby boys are...Ch. 12.5 - The weights for 12-month-old baby boys are...Ch. 12.5 - The weights for 12-month-old baby boys are...Ch. 12.5 - The table shows selected ages of licensed drivers...Ch. 12.5 - The table shows selected ages of licensed drivers...Ch. 12.5 - Prob. 33ECh. 12.5 - The table shows selected ages of licensed drivers...Ch. 12.5 - The table shows selected ages of licensed drivers...Ch. 12.5 - The table shows selected ages of licensed drivers...Ch. 12.5 - Writing in Mathematics
37.
Explain when it is...Ch. 12.5 - Writing in Mathematics Explain how to use a table...Ch. 12.5 - Make Sense? In Exercises 39-42, determine whether...Ch. 12.5 - Make Sense? In Exercises 39-42, determine whether...Ch. 12.5 - Make Sense? In Exercises 39-42, determine whether...Ch. 12.5 - Make Sense? In Exercises 39-42, determine whether...Ch. 12.5 - Find two z-scores so that 40% of the data in the...Ch. 12.5 - 44. A woman insists that she will never marry a...Ch. 12.5 - 45. The placement lest for a college has scores...Ch. 12.6 - CHECK POINT 1 In a 1996 study involving obesity in...Ch. 12.6 - CHECK POINT 2 The points in the scatter plot in...Ch. 12.6 - CHECK POINT 3 Use the data in Figure 1230 of Check...Ch. 12.6 - CHECK POINT 4 If you worked Check Point 2...Ch. 12.6 - Fill in each blank so that the resulting statement...Ch. 12.6 - Fill in each blank so that the resulting statement...Ch. 12.6 - Fill in each blank so that the resulting statement...Ch. 12.6 - Prob. 4CVCCh. 12.6 - Prob. 5CVCCh. 12.6 - Prob. 6CVCCh. 12.6 - In Exercises 4-7, determine whether each statement...Ch. 12.6 - In Exercises 1-8, make a scatter plot for the...Ch. 12.6 - In Exercises 1-8, make a scatter plot for the...Ch. 12.6 - In Exercises 1-8, make a scatter plot for the...Ch. 12.6 - In Exercises 1-8, make a scatter plot for the...Ch. 12.6 - Prob. 5ECh. 12.6 - In Exercises 1-8, make a scatter plot for the...Ch. 12.6 - In Exercises 1-8, make a scatter plot for the...Ch. 12.6 - In Exercises 1-8, make a scatter plot for the...Ch. 12.6 - The scatter plot in the figure shows the...Ch. 12.6 - The scatter plot in the figure shows the...Ch. 12.6 - The scatter plot in the figure shows the...Ch. 12.6 - The scatter plot in the figure shows the...Ch. 12.6 - The scatter plot in the figure shows the...Ch. 12.6 - The scatter plot in the figure shows the...Ch. 12.6 - The scatter plot in the figure shows the...Ch. 12.6 - The scatter plot in the figure shows the...Ch. 12.6 - The scatter plot in the figure shows the...Ch. 12.6 - The scalier plot in the figure shows the...Ch. 12.6 - Prob. 19ECh. 12.6 - Just as money doesn't buy happiness for...Ch. 12.6 - Just as money doesn't buy happiness for...Ch. 12.6 - Just as money doesn't buy happiness for...Ch. 12.6 - Just as money doesn't buy happiness for...Ch. 12.6 - Just as money doesn't buy happiness for...Ch. 12.6 - Just as money doesn't buy happiness for...Ch. 12.6 - Just as money doesn't buy happiness for...Ch. 12.6 - Use the scatter plots shown labeled (a)-(f), to...Ch. 12.6 - Use the scatter plots shown labeled (a)-(f), to...Ch. 12.6 - Use the scatter plots shown labeled (a)-(f), to...Ch. 12.6 - Use the scatter plots shown labeled (a)-(f), to...Ch. 12.6 - Compute r, the correlation coefficient, rounded to...Ch. 12.6 - Compute r, the correlation coefficient, rounded to...Ch. 12.6 - Compute r, the correlation coefficient, rounded to...Ch. 12.6 - Compute r, the correlation coefficient, rounded to...Ch. 12.6 - 35. Use the data in Exercise 5 to solve this...Ch. 12.6 - 36. Use the data in Exercise 6 to solve this...Ch. 12.6 - 37. Use the data in Exercise 7 to solve this...Ch. 12.6 - 38. Use the data in Exercise 8 to solve this...Ch. 12.6 - Prob. 39ECh. 12.6 - In Exercises 39-45, the correlation coefficient,...Ch. 12.6 - In Exercises 39-45, the correlation coefficient,...Ch. 12.6 - Prob. 42ECh. 12.6 - Prob. 43ECh. 12.6 - Prob. 44ECh. 12.6 - Prob. 45ECh. 12.6 - Prob. 46ECh. 12.6 - 47. What is a scatter plot?
Ch. 12.6 - How does a scatter plot indicate that two...Ch. 12.6 - Give an example of two variables with a strong...Ch. 12.6 - 50. Give an example of two variables with a strong...Ch. 12.6 - 51. What is meant by a regression line?
Ch. 12.6 - Prob. 52ECh. 12.6 - Prob. 53ECh. 12.6 - Prob. 54ECh. 12.6 - Prob. 55ECh. 12.6 - Prob. 56ECh. 12.6 - 57. Explain how to use the correlation coefficient...Ch. 12.6 - Prob. 58ECh. 12.6 - Make Sense? In Exercises 58-61, determine whether...Ch. 12.6 - Prob. 60ECh. 12.6 - Make Sense? In Exercises 58-61, determine whether...Ch. 12.6 - Prob. 62ECh. 12.6 - Use the linear regression feature of a graphing...Ch. 12.6 - 64. The group should select two variables related...Ch. 12.6 - Prob. 65ECh. 12 - 1. Politicians in the Florida Keys need to know if...Ch. 12 - A random sample of ten college students is...Ch. 12 - Prob. 3TCh. 12 - Prob. 4TCh. 12 - Prob. 5TCh. 12 - Prob. 6TCh. 12 - Prob. 7TCh. 12 - Prob. 8TCh. 12 - Use the six data items listed below to solve...Ch. 12 - Prob. 10TCh. 12 - Prob. 11TCh. 12 - Prob. 12TCh. 12 - Prob. 13TCh. 12 - Prob. 14TCh. 12 - Prob. 15TCh. 12 - Prob. 16TCh. 12 - Prob. 17TCh. 12 - Prob. 18TCh. 12 - Prob. 19TCh. 12 - Prob. 20TCh. 12 - Prob. 21TCh. 12 - Prob. 22TCh. 12 - Prob. 23TCh. 12 - Prob. 24TCh. 12 - Prob. 25TCh. 12 - Prob. 26TCh. 12 - 1. The government of a large city wants to know if...Ch. 12 - A random sample of ten college students is...Ch. 12 - A random sample of ten college students is...Ch. 12 - Prob. 4RECh. 12 - The 50 grades on a physiology lest are shown. Use...Ch. 12 - The 50 grades on a physiology test are shown. Use...Ch. 12 - Describe what is misleading about the size of the...Ch. 12 - In Exercises 8-9, find the mean for each group of...Ch. 12 - In Exercises 8-9, find the mean for each group of...Ch. 12 - Find the mean for the data items in the given...Ch. 12 - In Exercises 11-12, find the median for each group...Ch. 12 - In Exercises 11-12, find the median for each group...Ch. 12 - Find the median for the data items in the...Ch. 12 - In Exercises 14-15, find the mode for each group...Ch. 12 - In Exercises 14-15, find the mode for each group...Ch. 12 - 16. Find the mode for the data items in the...Ch. 12 - In Exercises 17-18, find the midrange for each...Ch. 12 - Prob. 18RECh. 12 - Prob. 19RECh. 12 - Prob. 20RECh. 12 - The data items below are the ages of U.S....Ch. 12 - Prob. 22RECh. 12 - Prob. 23RECh. 12 - Prob. 24RECh. 12 - Use the data items 36, 26, 24, 90, and 74 to find...Ch. 12 - Prob. 26RECh. 12 - Prob. 27RECh. 12 - Prob. 28RECh. 12 - Prob. 29RECh. 12 - 30. Describe how you would determine
a. which of...Ch. 12 - Prob. 31RECh. 12 - Prob. 32RECh. 12 - Prob. 33RECh. 12 - Prob. 34RECh. 12 - Prob. 35RECh. 12 - Prob. 36RECh. 12 - Prob. 37RECh. 12 - Prob. 38RECh. 12 - Prob. 39RECh. 12 - Prob. 40RECh. 12 - Prob. 41RECh. 12 - Prob. 42RECh. 12 - Prob. 43RECh. 12 - Prob. 44RECh. 12 - Prob. 45RECh. 12 - Prob. 46RECh. 12 - Prob. 47RECh. 12 - Prob. 48RECh. 12 - Prob. 49RECh. 12 - Prob. 50RECh. 12 - The histogram indicates the frequencies of the...Ch. 12 - The mean cholesterol level for all men in the...Ch. 12 - Prob. 53RECh. 12 - The mean cholesterol level for all men in the...Ch. 12 - The mean cholesterol level for all men in the...Ch. 12 - Prob. 56RECh. 12 - Prob. 57RECh. 12 - Prob. 58RECh. 12 - Prob. 59RECh. 12 - Prob. 60RECh. 12 - 61. There is a perfect negative correlation...Ch. 12 - 62. As the percentage of adult females who are...Ch. 12 - 63. The country with the least percentage of adult...Ch. 12 - Prob. 64RECh. 12 - Prob. 65RECh. 12 - Prob. 66RECh. 12 - Prob. 67RECh. 12 - Prob. 68RECh. 12 - Prob. 69RECh. 12 - Prob. 70RE
Knowledge Booster


Learn more about
Need a deep-dive on the concept behind this application? Look no further. Learn more about this topic, subject and related others by exploring similar questions and additional content below.Similar questions
- Consider the grades for the math and history exams for 10 students on a scale from 0 to 12 in the following table. Student Math History 1 4 8 2 5 9 3 7 9 4 12 10 5 10 8 6 8 5 7 9 6 8 9 6 9 11 9 10 7 10 Compute the Spearman correlation coefficient. Round your answer to three decimal places.arrow_forwardQ4 3 Points 1 Let A = 2 3 7 5 11 Give one nontrivial solution X of the homogeneous system Ax = 0. (Your vector x should have explicit numbers as its entries, as opposed to variables/parameters). Show your work for how you found it. Please select file(s) Select file(s) Save Answerarrow_forwardTo compare two elementary schools regarding teaching of reading skills, 12 sets of identical twins were used. In each case, one child was selected at random and sent to school A, and his or her twin was sent to school B. Near the end of fifth grade, an achievement test was given to each child. The results follow: Twin Pair 1 2 3 4 5 6 School A 169 157 115 99 119 113 School B 123 157 112 99 121 122 Twin Pair 7 8 9 10 11 12 School A 120 121 124 145 138 117 School B 153 90 124 140 142 102 Suppose a sign test for matched pairs with a 1% level of significance is used to test the hypothesis that the schools have the same effectiveness in teaching reading skills against the alternate hypothesis that the schools have different levels of effectiveness in teaching reading skills. Let p denote portion of positive signs when the scores of school B are subtracted from the corresponding scores of school…arrow_forward
- A horse trainer teaches horses to jump by using two methods of instruction. Horses being taught by method A have a lead horse that accompanies each jump. Horses being taught by method B have no lead horse. The table shows the number of training sessions required before each horse performed the jumps properly. Method A 25 23 39 29 37 20 Method B 41 21 46 42 24 44 Method A 45 35 27 31 34 49 Method B 26 43 47 32 40 Use a rank-sum test with a5% level of significance to test the claim that there is no difference between the training sessions distributions. If the value of the sample test statistic R, the rank-sum, is 150, calculate the P-value. Round your answer to four decimal places.arrow_forwardA data processing company has a training program for new salespeople. After completing the training program, each trainee is ranked by his or her instructor. After a year of sales, the same class of trainees is again ranked by a company supervisor according to net value of the contracts they have acquired for the company. The results for a random sample of 11 salespeople trained in the last year follow, where x is rank in training class and y is rank in sales after 1 year. Lower ranks mean higher standing in class and higher net sales. Person 1 2 3 4 5 6 x rank 8 11 2 4 5 3 y rank 7 10 1 3 2 4 Person 7 8 9 10 11 x rank 7 9 10 1 6 y rank 8 11 9 6 5 Using a 1% level of significance, test the claim that the relation between x and y is monotone (either increasing or decreasing). Verify that the Spearman rank correlation coefficient . This implies that the P-value lies between 0.002 and 0.01. State…arrow_forwardSand and clay studies were conducted at a site in California. Twelve consecutive depths, each about 15 cm deep, were studied and the following percentages of sand in the soil were recorded. 34.4 27.1 30.8 28.0 32.2 27.6 32.8 25.2 31.4 33.5 24.7 28.4 Converting this sequence of numbers to a sequence of symbols A and B, where A indicates a value above the median and B denotes a value below the median gives ABABABABAABB. Test the sequence for randomness about the median with a 5% level of significance. Verify that the number of runs is 10. What is the upper critical value c2? arrow_forward
- Sand and clay studies were conducted at a site in California. Twelve consecutive depths, each about 15 cm deep, were studied and the following percentages of sand in the soil were recorded. 34.4 27.1 30.8 28.0 32.2 27.6 32.8 25.2 31.4 33.5 24.7 28.4 Converting this sequence of numbers to a sequence of symbols A and B, where A indicates a value above the median and B denotes a value below the median gives ABABABABAABB. Test the sequence for randomness about the median with a 5% level of significance. Verify that the number of runs is 10. What is the upper critical value c2?arrow_forward29% of all college students major in STEM (Science, Technology, Engineering, and Math). If 46 college students are randomly selected, find the probability thata. Exactly 11 of them major in STEM. b. At most 12 of them major in STEM. c. At least 11 of them major in STEM. d. Between 11 and 15 (including 11 and 15) of them major in STEM.arrow_forwardSand and clay studies were conducted at a site in California. Twelve consecutive depths, each about 15 cm deep, were studied and the following percentages of sand in the soil were recorded. 27.3 34.6 30.6 27.8 33.4 31.5 27.3 31.2 32.0 24.7 24.4 28.2 Test this sequence for randomness about the median. Converting this sequence of numbers to a sequence of symbols A and B, where A indicates a value above the median and B denotes a value below the median gives BAABAABAABBB. Verify that the number of runs is 7, the lower critical number is 3, and the upper critical number is 11. Use a 5% level of significance. State the conclusion of the test and interpret your results.arrow_forward
- 29% of all college students major in STEM (Science, Technology, Engineering, and Math). If 46 college students are randomly selected, find the probability thata. Exactly 11 of them major in STEM. b. At most 12 of them major in STEM. c. At least 11 of them major in STEM. d. Between 11 and 15 (including 11 and 15) of them major in STEM.arrow_forward4. Assume that a risk-free money market account is added to the market described in Q3. The continuously compounded rate of return on the money market account is log (1.1). (i) For each given μ, use Lagrange multipliers to determine the proportions (as a function of μ) of wealth invested in the three assets available for the minimum variance portfolio with expected return μ. (ii) Determine the market portfolio in this market and calculate its Sharp ratio.arrow_forward3. A market consists of two risky assets with rates of return R₁ and R2 and no risk-free asset. From market data the following have been estimated: ER₁ = 0.25, ER2 = 0.05, Var R₁ = 0.01, Var R2 = 0.04 and the correlation between R1 and R2 is p = -0.75. (i) Given that an investor is targeting a total expected return of μ = 0.2. What portfolio weights should they choose to meet this goal with minimum portfolio variance? Correct all your calculations up to 4 decimal points. (ii) Determine the global minimum-variance portfolio and the expected return and variance of return of this portfolio (4 d.p.). (iii) Sketch the minimum-variance frontier in the μ-σ² plane and indicate the efficient frontier. (iv) Without further calculation, explain how the minimum variance of the investor's portfolio return will change if the two risky assets were independent.arrow_forward
arrow_back_ios
SEE MORE QUESTIONS
arrow_forward_ios
Recommended textbooks for you
 Big Ideas Math A Bridge To Success Algebra 1: Stu...AlgebraISBN:9781680331141Author:HOUGHTON MIFFLIN HARCOURTPublisher:Houghton Mifflin Harcourt
 Glencoe Algebra 1, Student Edition, 9780079039897...AlgebraISBN:9780079039897Author:CarterPublisher:McGraw Hill
 Holt Mcdougal Larson Pre-algebra: Student Edition...AlgebraISBN:9780547587776Author:HOLT MCDOUGALPublisher:HOLT MCDOUGAL
Big Ideas Math A Bridge To Success Algebra 1: Stu...
Algebra
ISBN:9781680331141
Author:HOUGHTON MIFFLIN HARCOURT
Publisher:Houghton Mifflin Harcourt
Glencoe Algebra 1, Student Edition, 9780079039897...
Algebra
ISBN:9780079039897
Author:Carter
Publisher:McGraw Hill
Holt Mcdougal Larson Pre-algebra: Student Edition...
Algebra
ISBN:9780547587776
Author:HOLT MCDOUGAL
Publisher:HOLT MCDOUGAL
The Shape of Data: Distributions: Crash Course Statistics #7; Author: CrashCourse;https://www.youtube.com/watch?v=bPFNxD3Yg6U;License: Standard YouTube License, CC-BY
Shape, Center, and Spread - Module 20.2 (Part 1); Author: Mrmathblog;https://www.youtube.com/watch?v=COaid7O_Gag;License: Standard YouTube License, CC-BY
Shape, Center and Spread; Author: Emily Murdock;https://www.youtube.com/watch?v=_YyW0DSCzpM;License: Standard Youtube License