
Elementary Statistics: A Step By Step Approach
9th Edition
ISBN: 9780073534985
Author: Allan Bluman
Publisher: McGraw-Hill Science/Engineering/Math
expand_more
expand_more
format_list_bulleted
Concept explainers
Videos
Textbook Question
Chapter 12.3, Problem 1AC
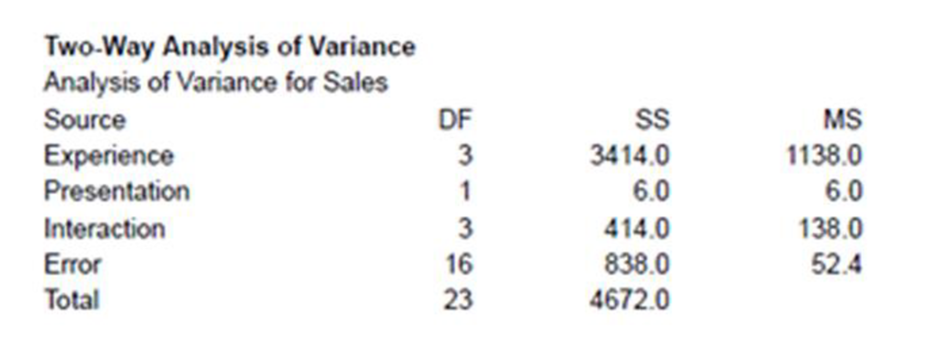
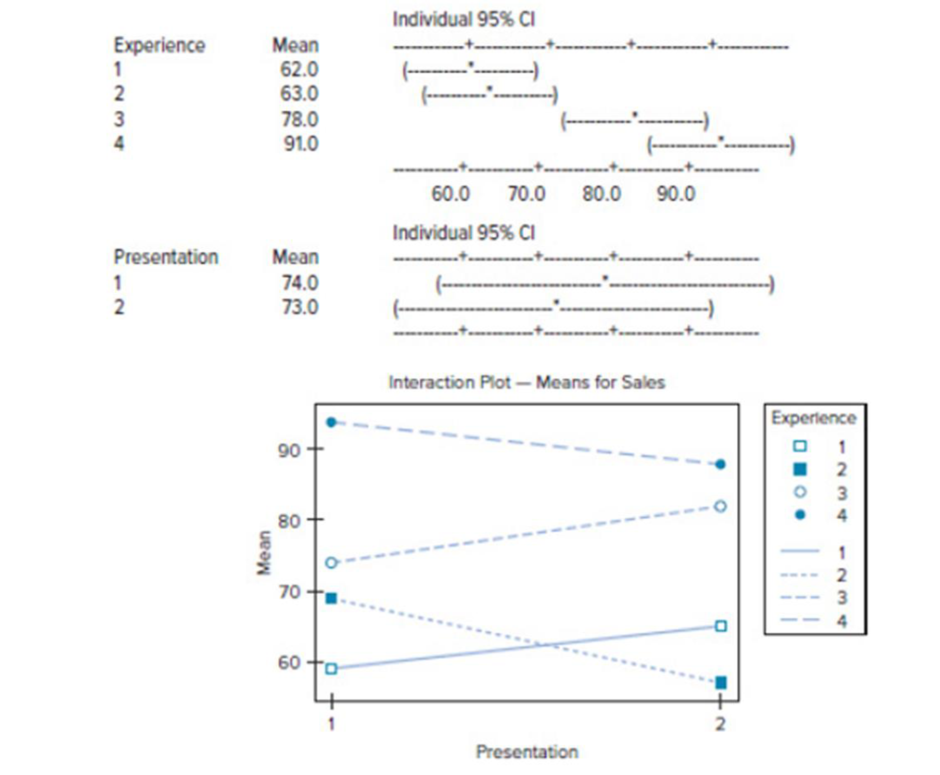
Automobile Sales Techniques
The following outputs are from the result of an analysis of how car sales are affected by the experience of the salesperson and the type of sales technique used. Experience was broken up into four levels, and two different sales techniques were used. Analyze the results and draw conclusions about level of experience with respect to the two different sales techniques and how they affect car sales.
Expert Solution & Answer
Want to see the full answer?
Check out a sample textbook solution
Students have asked these similar questions
Business discuss
Business discuss
I just need to know why this is wrong below:
What is the test statistic W? W=5 (incorrect)
and
What is the p-value of this test? (p-value < 0.001-- incorrect)
Use the Wilcoxon signed rank test to test the hypothesis that the median number of pages in the statistics books in the library from which the sample was taken is 400. A sample of 12 statistics books have the following numbers of pages
pages
127
217
486
132
397
297
396
327
292
256
358
272
What is the sum of the negative ranks (W-)? 75 What is the sum of the positive ranks (W+)? 5What type of test is this? two tailedWhat is the test statistic W? 5 These are the critical values for a 1-tailed Wilcoxon Signed Rank test for n=12
Alpha Level
0.001
0.005
0.01
0.025
0.05
0.1
0.2
Critical Value
75
70
68
64
60
56
50
What is the p-value for this test? p-value < 0.001
Chapter 12 Solutions
Elementary Statistics: A Step By Step Approach
Ch. 12.1 - Colors That Make You Smarter The following set of...Ch. 12.1 - What test is used to compare three or more means?Ch. 12.1 - State three reasons why multiple t tests cannot be...Ch. 12.1 - What are the assumptions for ANOVA?Ch. 12.1 - Define between-group variance and within-group...Ch. 12.1 - State the hypotheses used in the ANOVA test.Ch. 12.1 - When there is no significant difference among...Ch. 12.1 - Prob. 7ECh. 12.1 - For Exercises 7 through 20, assume that all...Ch. 12.1 - For Exercises 7 through 20, assume that all...
Ch. 12.1 - For Exercises 7 through 20, assume that all...Ch. 12.1 - Prob. 11ECh. 12.1 - For Exercises 7 through 20, assume that all...Ch. 12.1 - For Exercises 7 through 20, assume that all...Ch. 12.1 - For Exercises 7 through 20, assume that all...Ch. 12.1 - Prob. 15ECh. 12.1 - For Exercises 7 through 20, assume that all...Ch. 12.1 - For Exercises 7 through 20, assume that all...Ch. 12.1 - For Exercises 7 through 20, assume that all...Ch. 12.1 - For Exercises 7 through 20, assume that all...Ch. 12.1 - For Exercises 7 through 20, assume that all...Ch. 12.2 - Colors That Make You Smarter The following set of...Ch. 12.2 - What two tests can be used to compare two means...Ch. 12.2 - Explain the difference between the two tests used...Ch. 12.2 - For Exercises 3 through 8, the null hypothesis was...Ch. 12.2 - For Exercises 3 through 8, the null hypothesis was...Ch. 12.2 - For Exercises 3 through 8, the null hypothesis was...Ch. 12.2 - For Exercises 3 through 8, the null hypothesis was...Ch. 12.2 - For Exercises 3 through 8, the null hypothesis was...Ch. 12.2 - For Exercises 3 through 8, the null hypothesis was...Ch. 12.2 - For Exercises 9 through 13, do a complete one-way...Ch. 12.2 - Prob. 10ECh. 12.2 - For Exercises 9 through 13, do a complete one-way...Ch. 12.2 - For Exercises 9 through 13, do a complete one-way...Ch. 12.2 - Prob. 13ECh. 12.3 - Automobile Sales Techniques The following outputs...Ch. 12.3 - Prob. 1ECh. 12.3 - Explain what is meant by main effects and...Ch. 12.3 - Prob. 3ECh. 12.3 - How are the F test values computed?Ch. 12.3 - Prob. 5ECh. 12.3 - In a two-way ANOVA, variable A has six levels and...Ch. 12.3 - Prob. 7ECh. 12.3 - When can the main effects for the two-way ANOVA be...Ch. 12.3 - Prob. 9ECh. 12.3 - For Exercises 9 through 15, perform these steps....Ch. 12.3 - For Exercises 9 through 15, perform these steps....Ch. 12.3 - For Exercises 9 through 15, perform these steps....Ch. 12.3 - Prob. 13ECh. 12.3 - For Exercises 9 through 15, perform these steps....Ch. 12.3 - Prob. 15ECh. 12 - If the null hypothesis is rejected in Exercises 1...Ch. 12 - Prob. 12.1.2RECh. 12 - Prob. 12.1.3RECh. 12 - Prob. 12.1.4RECh. 12 - Prob. 12.1.5RECh. 12 - If the null hypothesis is rejected in Exercises 1...Ch. 12 - Prob. 12.1.7RECh. 12 - Prob. 12.1.8RECh. 12 - Review Preparation for Statistics A statistics...Ch. 12 - Effects of Different Types of Diets A medical...Ch. 12 - Prob. 1DACh. 12 - Prob. 2DACh. 12 - Prob. 3DACh. 12 - Prob. 1CQCh. 12 - Prob. 2CQCh. 12 - Prob. 3CQCh. 12 - Determine whether each statement is true or false....Ch. 12 - Prob. 5CQCh. 12 - Prob. 6CQCh. 12 - Prob. 7CQCh. 12 - Prob. 8CQCh. 12 - Complete the following statements with the best...Ch. 12 - Prob. 10CQCh. 12 - For Exercises 11 through 17, use the traditional...Ch. 12 - Prob. 12CQCh. 12 - Prob. 13CQCh. 12 - Prob. 14CQCh. 12 - Prob. 15CQCh. 12 - Prob. 16CQCh. 12 - For Exercises 11 through 17, use the traditional...Ch. 12 - Shown here are the abstract and two tables from a...Ch. 12 - Shown here are the abstract and two tables from a...Ch. 12 - Prob. 3CTCCh. 12 - Prob. 4CTCCh. 12 - Prob. 5CTCCh. 12 - Prob. 6CTCCh. 12 - Prob. 7CTCCh. 12 - Adult Children of Alcoholics Shown here are the...Ch. 12 - Prob. 9CTCCh. 12 - Prob. 10CTCCh. 12 - Prob. 11CTC
Additional Math Textbook Solutions
Find more solutions based on key concepts
For Exercises 13–18, write the negation of the statement.
13. The cell phone is out of juice.
Math in Our World
Provide an example of a qualitative variable and an example of a quantitative variable.
Elementary Statistics ( 3rd International Edition ) Isbn:9781260092561
153. A rain gutter is made from sheets of aluminum that are 20 inches wide. As shown in the figure, the edges ...
College Algebra (7th Edition)
The first derivative of function y=25x4.
Calculus for Business, Economics, Life Sciences, and Social Sciences (14th Edition)
(a) Make a stem-and-leaf plot for these 24 observations on the number of customers who used a down-town CitiBan...
APPLIED STAT.IN BUS.+ECONOMICS
Knowledge Booster


Learn more about
Need a deep-dive on the concept behind this application? Look no further. Learn more about this topic, statistics and related others by exploring similar questions and additional content below.Similar questions
- ons 12. A sociologist hypothesizes that the crime rate is higher in areas with higher poverty rate and lower median income. She col- lects data on the crime rate (crimes per 100,000 residents), the poverty rate (in %), and the median income (in $1,000s) from 41 New England cities. A portion of the regression results is shown in the following table. Standard Coefficients error t stat p-value Intercept -301.62 549.71 -0.55 0.5864 Poverty 53.16 14.22 3.74 0.0006 Income 4.95 8.26 0.60 0.5526 a. b. Are the signs as expected on the slope coefficients? Predict the crime rate in an area with a poverty rate of 20% and a median income of $50,000. 3. Using data from 50 workarrow_forward2. The owner of several used-car dealerships believes that the selling price of a used car can best be predicted using the car's age. He uses data on the recent selling price (in $) and age of 20 used sedans to estimate Price = Po + B₁Age + ε. A portion of the regression results is shown in the accompanying table. Standard Coefficients Intercept 21187.94 Error 733.42 t Stat p-value 28.89 1.56E-16 Age -1208.25 128.95 -9.37 2.41E-08 a. What is the estimate for B₁? Interpret this value. b. What is the sample regression equation? C. Predict the selling price of a 5-year-old sedan.arrow_forwardian income of $50,000. erty rate of 13. Using data from 50 workers, a researcher estimates Wage = Bo+B,Education + B₂Experience + B3Age+e, where Wage is the hourly wage rate and Education, Experience, and Age are the years of higher education, the years of experience, and the age of the worker, respectively. A portion of the regression results is shown in the following table. ni ogolloo bash 1 Standard Coefficients error t stat p-value Intercept 7.87 4.09 1.93 0.0603 Education 1.44 0.34 4.24 0.0001 Experience 0.45 0.14 3.16 0.0028 Age -0.01 0.08 -0.14 0.8920 a. Interpret the estimated coefficients for Education and Experience. b. Predict the hourly wage rate for a 30-year-old worker with four years of higher education and three years of experience.arrow_forward
- 1. If a firm spends more on advertising, is it likely to increase sales? Data on annual sales (in $100,000s) and advertising expenditures (in $10,000s) were collected for 20 firms in order to estimate the model Sales = Po + B₁Advertising + ε. A portion of the regression results is shown in the accompanying table. Intercept Advertising Standard Coefficients Error t Stat p-value -7.42 1.46 -5.09 7.66E-05 0.42 0.05 8.70 7.26E-08 a. Interpret the estimated slope coefficient. b. What is the sample regression equation? C. Predict the sales for a firm that spends $500,000 annually on advertising.arrow_forwardCan you help me solve problem 38 with steps im stuck.arrow_forwardHow do the samples hold up to the efficiency test? What percentages of the samples pass or fail the test? What would be the likelihood of having the following specific number of efficiency test failures in the next 300 processors tested? 1 failures, 5 failures, 10 failures and 20 failures.arrow_forward
- The battery temperatures are a major concern for us. Can you analyze and describe the sample data? What are the average and median temperatures? How much variability is there in the temperatures? Is there anything that stands out? Our engineers’ assumption is that the temperature data is normally distributed. If that is the case, what would be the likelihood that the Safety Zone temperature will exceed 5.15 degrees? What is the probability that the Safety Zone temperature will be less than 4.65 degrees? What is the actual percentage of samples that exceed 5.25 degrees or are less than 4.75 degrees? Is the manufacturing process producing units with stable Safety Zone temperatures? Can you check if there are any apparent changes in the temperature pattern? Are there any outliers? A closer look at the Z-scores should help you in this regard.arrow_forwardNeed help pleasearrow_forwardPlease conduct a step by step of these statistical tests on separate sheets of Microsoft Excel. If the calculations in Microsoft Excel are incorrect, the null and alternative hypotheses, as well as the conclusions drawn from them, will be meaningless and will not receive any points. 4. One-Way ANOVA: Analyze the customer satisfaction scores across four different product categories to determine if there is a significant difference in means. (Hints: The null can be about maintaining status-quo or no difference among groups) H0 = H1=arrow_forward
- Please conduct a step by step of these statistical tests on separate sheets of Microsoft Excel. If the calculations in Microsoft Excel are incorrect, the null and alternative hypotheses, as well as the conclusions drawn from them, will be meaningless and will not receive any points 2. Two-Sample T-Test: Compare the average sales revenue of two different regions to determine if there is a significant difference. (Hints: The null can be about maintaining status-quo or no difference among groups; if alternative hypothesis is non-directional use the two-tailed p-value from excel file to make a decision about rejecting or not rejecting null) H0 = H1=arrow_forwardPlease conduct a step by step of these statistical tests on separate sheets of Microsoft Excel. If the calculations in Microsoft Excel are incorrect, the null and alternative hypotheses, as well as the conclusions drawn from them, will be meaningless and will not receive any points 3. Paired T-Test: A company implemented a training program to improve employee performance. To evaluate the effectiveness of the program, the company recorded the test scores of 25 employees before and after the training. Determine if the training program is effective in terms of scores of participants before and after the training. (Hints: The null can be about maintaining status-quo or no difference among groups; if alternative hypothesis is non-directional, use the two-tailed p-value from excel file to make a decision about rejecting or not rejecting the null) H0 = H1= Conclusion:arrow_forwardPlease conduct a step by step of these statistical tests on separate sheets of Microsoft Excel. If the calculations in Microsoft Excel are incorrect, the null and alternative hypotheses, as well as the conclusions drawn from them, will be meaningless and will not receive any points. The data for the following questions is provided in Microsoft Excel file on 4 separate sheets. Please conduct these statistical tests on separate sheets of Microsoft Excel. If the calculations in Microsoft Excel are incorrect, the null and alternative hypotheses, as well as the conclusions drawn from them, will be meaningless and will not receive any points. 1. One Sample T-Test: Determine whether the average satisfaction rating of customers for a product is significantly different from a hypothetical mean of 75. (Hints: The null can be about maintaining status-quo or no difference; If your alternative hypothesis is non-directional (e.g., μ≠75), you should use the two-tailed p-value from excel file to…arrow_forward
arrow_back_ios
SEE MORE QUESTIONS
arrow_forward_ios
Recommended textbooks for you
 Big Ideas Math A Bridge To Success Algebra 1: Stu...AlgebraISBN:9781680331141Author:HOUGHTON MIFFLIN HARCOURTPublisher:Houghton Mifflin Harcourt
 Glencoe Algebra 1, Student Edition, 9780079039897...AlgebraISBN:9780079039897Author:CarterPublisher:McGraw Hill
 Holt Mcdougal Larson Pre-algebra: Student Edition...AlgebraISBN:9780547587776Author:HOLT MCDOUGALPublisher:HOLT MCDOUGAL
 Functions and Change: A Modeling Approach to Coll...AlgebraISBN:9781337111348Author:Bruce Crauder, Benny Evans, Alan NoellPublisher:Cengage Learning
 Linear Algebra: A Modern IntroductionAlgebraISBN:9781285463247Author:David PoolePublisher:Cengage Learning
Big Ideas Math A Bridge To Success Algebra 1: Stu...
Algebra
ISBN:9781680331141
Author:HOUGHTON MIFFLIN HARCOURT
Publisher:Houghton Mifflin Harcourt
Glencoe Algebra 1, Student Edition, 9780079039897...
Algebra
ISBN:9780079039897
Author:Carter
Publisher:McGraw Hill
Holt Mcdougal Larson Pre-algebra: Student Edition...
Algebra
ISBN:9780547587776
Author:HOLT MCDOUGAL
Publisher:HOLT MCDOUGAL
Functions and Change: A Modeling Approach to Coll...
Algebra
ISBN:9781337111348
Author:Bruce Crauder, Benny Evans, Alan Noell
Publisher:Cengage Learning
Linear Algebra: A Modern Introduction
Algebra
ISBN:9781285463247
Author:David Poole
Publisher:Cengage Learning
Correlation Vs Regression: Difference Between them with definition & Comparison Chart; Author: Key Differences;https://www.youtube.com/watch?v=Ou2QGSJVd0U;License: Standard YouTube License, CC-BY
Correlation and Regression: Concepts with Illustrative examples; Author: LEARN & APPLY : Lean and Six Sigma;https://www.youtube.com/watch?v=xTpHD5WLuoA;License: Standard YouTube License, CC-BY