
Concept explainers
Videos
For Exercises 11 through 17, use the traditional method of hypothesis testing unless otherwise specified. Assume the assumptions have been met.
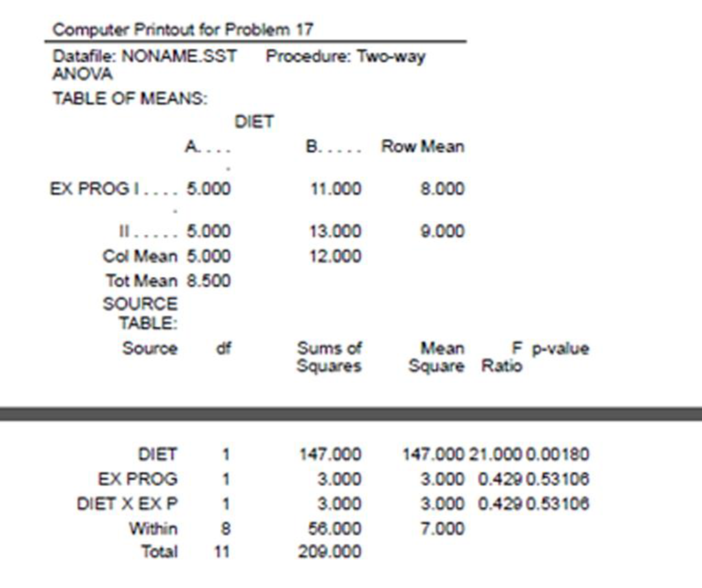
17. Diets and Exercise Programs A researcher conducted a study of two different diets and two different exercise programs. Three randomly selected subjects were assigned to each group for one month. The values indicate the amount of weight each lost.
| Diet | ||
| Exercise program | A | B |
| I | 5, 6, 4 | 8, 10, 15 |
| II | 3, 4, 8 | 12, 16, 11 |
Answer the following questions for the information in the printout shown.
a. What procedure is being used?
b. What are the names of the two variables?
c. How many levels does each variable contain?
d. What are the hypotheses for the study?
e. What are the F values for the hypotheses? State which are significant, using the P-values.
f. Based on the answers to part ε, which hypotheses can be rejected?

Trending nowThis is a popular solution!

Chapter 12 Solutions
Elementary Statistics: A Step By Step Approach


- Show all workarrow_forwardplease find the answers for the yellows boxes using the information and the picture belowarrow_forwardA marketing agency wants to determine whether different advertising platforms generate significantly different levels of customer engagement. The agency measures the average number of daily clicks on ads for three platforms: Social Media, Search Engines, and Email Campaigns. The agency collects data on daily clicks for each platform over a 10-day period and wants to test whether there is a statistically significant difference in the mean number of daily clicks among these platforms. Conduct ANOVA test. You can provide your answer by inserting a text box and the answer must include: also please provide a step by on getting the answers in excel Null hypothesis, Alternative hypothesis, Show answer (output table/summary table), and Conclusion based on the P value.arrow_forward
- A company found that the daily sales revenue of its flagship product follows a normal distribution with a mean of $4500 and a standard deviation of $450. The company defines a "high-sales day" that is, any day with sales exceeding $4800. please provide a step by step on how to get the answers Q: What percentage of days can the company expect to have "high-sales days" or sales greater than $4800? Q: What is the sales revenue threshold for the bottom 10% of days? (please note that 10% refers to the probability/area under bell curve towards the lower tail of bell curve) Provide answers in the yellow cellsarrow_forwardBusiness Discussarrow_forwardThe following data represent total ventilation measured in liters of air per minute per square meter of body area for two independent (and randomly chosen) samples. Analyze these data using the appropriate non-parametric hypothesis testarrow_forward
 Glencoe Algebra 1, Student Edition, 9780079039897...AlgebraISBN:9780079039897Author:CarterPublisher:McGraw Hill
 College Algebra (MindTap Course List)AlgebraISBN:9781305652231Author:R. David Gustafson, Jeff HughesPublisher:Cengage Learning
 Holt Mcdougal Larson Pre-algebra: Student Edition...AlgebraISBN:9780547587776Author:HOLT MCDOUGALPublisher:HOLT MCDOUGAL