
Concept explainers
Videos
If the null hypothesis is rejected in Exercises 1 through 8, use the Scheffé test when the
a. State the hypotheses and identify the claim.
b. Find the critical value(s).
c. Compute the test value.
d. Make the decision.
e. Summarize the results.
Use the traditional method of hypothesis testing unless otherwise specified.
1. Lengths of Various Types of Bridges The data represent the lengths in feet of three types of bridges in the United States. At a = 0.01, test the claim that there is no significant difference in the means of the lengths of the types of bridges.
| Simple truss | Segmented concrete | Continuous plate |
| 745 | 820 | 630 |
| 716 | 750 | 573 |
| 700 | 790 | 525 |
| 650 | 674 | 510 |
| 647 | 660 | 480 |
| 625 | 640 | 460 |
| 608 | 636 | 451 |
| 598 | 620 | 450 |
| 550 | 520 | 450 |
| 545 | 450 | 425 |
| 534 | 392 | 420 |
| 528 | 370 | 360 |
a.
To state: The hypothesis
To identify: The claim.
Answer to Problem 12.1.1RE
The hypothesis
The claim is that, all the means are same.
Explanation of Solution
Given info:
The data shows the lengths in feet of three types of bridges in the United States. The level of significance is 0.01.
Calculation:
The hypotheses are given below:
Null hypothesis:
Alternative hypothesis:
Here, all the means are same is tested. Hence, the claim is that, all the means are same.
b.
To find: The critical value.
Answer to Problem 12.1.1RE
The critical value is 5.285.
Explanation of Solution
Given info:
The level of significance is 0.01. The number of samples k is 3, the sample sizes
Calculation:
The degrees of freedom are
Where
Substitute 3 for k in
Substitute 36 for N and 3 for k in
Critical value:
The critical F-value is obtained using the Table H: The F-Distribution with the level of significance
Procedure:
- Locate 30 and 40 in the degrees of freedom, denominator row of the Table H.
- Obtain the value in the corresponding degrees of freedom, numerator column below 2.
That is,
That is, the critical value is 5.285.
Rejection region:
The null hypothesis would be rejected if
c.
To compute: The test value.
Answer to Problem 12.1.1RE
The test value is 6.94.
Explanation of Solution
Calculation:
Software procedure:
Step-by-step procedure to obtain the test statistic using the MINITAB software:
- Choose Stat > ANOVA > One-Way.
- In Response, enter the Temperatures.
- In Factor, enter the Factor.
- Click OK.
Output using the MINITAB software is given below:
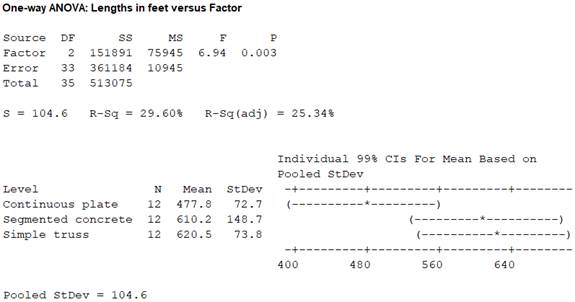
From the MINITAB output, the test value F is 6.94.
d.
To make: The decision.
Answer to Problem 12.1.1RE
The null hypothesis is rejected.
Explanation of Solution
Conclusion:
From the result of part (c), the test value is 6.94.
Here, the F-statistic value is greater than the critical value.
That is,
Thus, it can be concluding that, the null hypothesis is rejected.
e.
To explain: The results.
Answer to Problem 12.1.1RE
The result concludes that, there is a significant difference between the means
Explanation of Solution
Calculation:
From the results, it can be observed that the null hypothesis is rejected. Thus, it can be concluding that there is evidence to reject the claim that all means are same.
Consider,
Step-by-step procedure to obtain the test mean and standard deviation using the MINITAB software:
- Choose Stat > Basic Statistics > Display Descriptive Statistics.
- In Variables enter the columns Florida, Pennsylvania and Maine.
- Choose option statistics, and select Mean, Variance and N total.
- Click OK.
Output using the MINITAB software is given below:
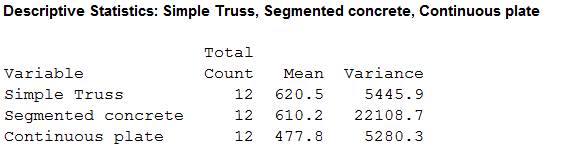
The sample sizes
The means are
The sample variances are
Here, the samples of sizes of three states are equal. So, the test used here is Tukey test.
Tukey test:
Critical value:
Here, k is 3 and degrees of freedom
Substitute 36 for N and 3 for k in v
The critical F-value is obtained using the Table N: Critical Values for the Tukey test with the level of significance
Procedure:
- Locate nearest value of 33 in the column of v of the Table H.
- Obtain the value in the corresponding row below 3.
That is, the critical value is 4.45.
Comparison of the means:
The formula for finding
That is,
Comparison between the means
The hypotheses are given below:
Null hypothesis:
Alternative hypothesis:
Rejection region:
The null hypothesis would be rejected if absolute value greater than the critical value.
Absolute value:
The formula for comparing the means
Substitute 620.5 and 610.2 for
Thus, the value of
Hence, the absolute value of
Conclusion:
The absolute value is 0.34.
Here, the absolute value is lesser than the critical value.
That is,
Thus, the null hypothesis is not rejected.
Hence, there is no significant difference between the means
Comparison between the means
The hypotheses are given below:
Null hypothesis:
Alternative hypothesis:
Rejection region:
The null hypothesis would be rejected if absolute value greater than the critical value.
Absolute value:
The formula for comparing the means
Substitute 620.5 and 477.8 for
Thus, the value of
Hence, the absolute value of
Conclusion:
The absolute value is 4.72.
Here, the absolute value is greater than the critical value.
That is,
Thus, the null hypothesis is rejected.
Hence, there is significant difference between the means
Comparison between the means
The hypotheses are given below:
Null hypothesis:
Alternative hypothesis:
Rejection region:
The null hypothesis would be rejected if absolute value greater than the critical value.
Absolute value:
The formula for comparing the means
Substitute 610.2 and 477.8 for
Thus, the value of
Hence, the absolute value of
Conclusion:
The absolute value is 4.38.
Here, the absolute value is lesser than the critical value.
That is,
Thus, the null hypothesis is not rejected.
Hence, there is no significant difference between the means
Want to see more full solutions like this?
Chapter 12 Solutions
Elementary Statistics: A Step By Step Approach


- A company found that the daily sales revenue of its flagship product follows a normal distribution with a mean of $4500 and a standard deviation of $450. The company defines a "high-sales day" that is, any day with sales exceeding $4800. please provide a step by step on how to get the answers in excel Q: What percentage of days can the company expect to have "high-sales days" or sales greater than $4800? Q: What is the sales revenue threshold for the bottom 10% of days? (please note that 10% refers to the probability/area under bell curve towards the lower tail of bell curve) Provide answers in the yellow cellsarrow_forwardFind the critical value for a left-tailed test using the F distribution with a 0.025, degrees of freedom in the numerator=12, and degrees of freedom in the denominator = 50. A portion of the table of critical values of the F-distribution is provided. Click the icon to view the partial table of critical values of the F-distribution. What is the critical value? (Round to two decimal places as needed.)arrow_forwardA retail store manager claims that the average daily sales of the store are $1,500. You aim to test whether the actual average daily sales differ significantly from this claimed value. You can provide your answer by inserting a text box and the answer must include: Null hypothesis, Alternative hypothesis, Show answer (output table/summary table), and Conclusion based on the P value. Showing the calculation is a must. If calculation is missing,so please provide a step by step on the answers Numerical answers in the yellow cellsarrow_forward
 Glencoe Algebra 1, Student Edition, 9780079039897...AlgebraISBN:9780079039897Author:CarterPublisher:McGraw Hill
 College Algebra (MindTap Course List)AlgebraISBN:9781305652231Author:R. David Gustafson, Jeff HughesPublisher:Cengage Learning