
Concept explainers
Videos
For Exercises 7 through 20, assume that all variables are
a. State the hypotheses and identify the claim.
b. Find the critical value.
c. Compute the test value.
d. Make the decision.
e. Summarize the results, and explain where the differences in the
Use the traditional method of hypothesis testing unless otherwise specified.
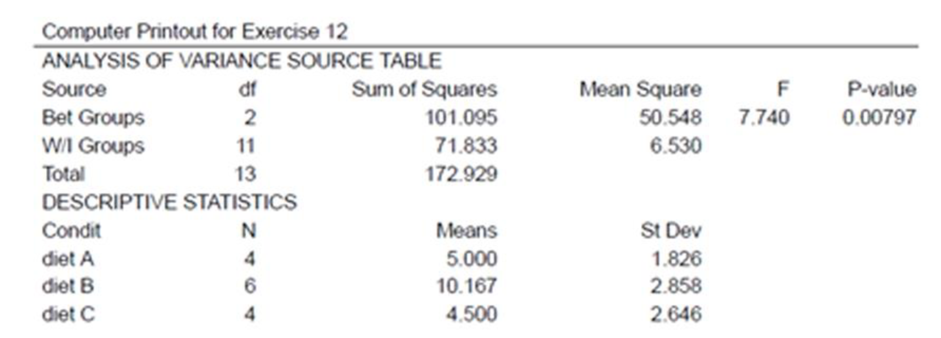
12. Weight Gain of Athletes A researcher wishes to see whether there is any difference in the weight gains of athletes following one of three special diets. Athletes are randomly assigned to three groups and placed on the diet for 6 weeks. The weight gains (in pounds) are shown here. At a = 0.05, can the researcher conclude that there is a difference in the diets?
| Did A | Diet B | Diet C |
| 3 | 10 | 8 |
| 6 | 12 | 3 |
| 7 | 11 | 2 |
| 4 | 14 | 5 |
| 8 | ||
| 6 |
A computer printout for this problem is shown. Use the P-value method and the information in this printout to test the claim. (The information in this exercise will be used in Exercise 4 of Section 12-2.)
Want to see the full answer?
Check out a sample textbook solution
Chapter 12 Solutions
ELEMENTARY STATISTICS: STEP BY STEP- ALE


- Show all workarrow_forwardplease find the answers for the yellows boxes using the information and the picture belowarrow_forwardA marketing agency wants to determine whether different advertising platforms generate significantly different levels of customer engagement. The agency measures the average number of daily clicks on ads for three platforms: Social Media, Search Engines, and Email Campaigns. The agency collects data on daily clicks for each platform over a 10-day period and wants to test whether there is a statistically significant difference in the mean number of daily clicks among these platforms. Conduct ANOVA test. You can provide your answer by inserting a text box and the answer must include: also please provide a step by on getting the answers in excel Null hypothesis, Alternative hypothesis, Show answer (output table/summary table), and Conclusion based on the P value.arrow_forward
- A company found that the daily sales revenue of its flagship product follows a normal distribution with a mean of $4500 and a standard deviation of $450. The company defines a "high-sales day" that is, any day with sales exceeding $4800. please provide a step by step on how to get the answers Q: What percentage of days can the company expect to have "high-sales days" or sales greater than $4800? Q: What is the sales revenue threshold for the bottom 10% of days? (please note that 10% refers to the probability/area under bell curve towards the lower tail of bell curve) Provide answers in the yellow cellsarrow_forwardBusiness Discussarrow_forwardThe following data represent total ventilation measured in liters of air per minute per square meter of body area for two independent (and randomly chosen) samples. Analyze these data using the appropriate non-parametric hypothesis testarrow_forward
 Glencoe Algebra 1, Student Edition, 9780079039897...AlgebraISBN:9780079039897Author:CarterPublisher:McGraw Hill
 Big Ideas Math A Bridge To Success Algebra 1: Stu...AlgebraISBN:9781680331141Author:HOUGHTON MIFFLIN HARCOURTPublisher:Houghton Mifflin Harcourt