
ELEMENTARY STATISTICS-MYLAB STAT.ACCESS
13th Edition
ISBN: 8220115564941
Author: Triola
Publisher: PEARSON
expand_more
expand_more
format_list_bulleted
Videos
Textbook Question
Chapter 12, Problem 9CQQ
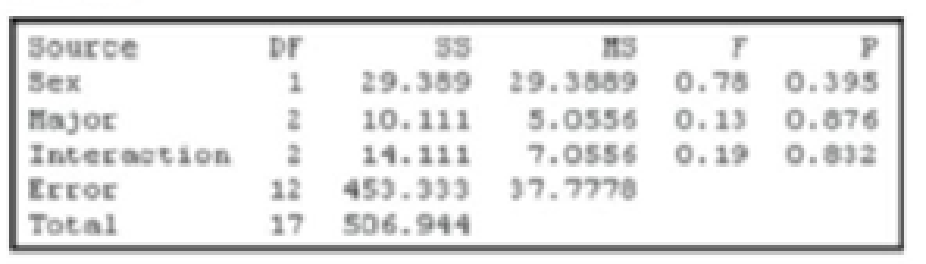
Estimating Length Using the same results displayed in Exercise 8, does it appear that the length estimates are affected by the sex of the subject?
8. Estimating Length Given below is a Minitab display resulting from two-way analysis of variance with sample data consisting of 18 different student visual estimates of the length of a classroom. The values are categorized according to sex and major (math, business, liberal arts). What do you conclude about an interaction between sex and major?
Minitab
Expert Solution & Answer
Want to see the full answer?
Check out a sample textbook solution
Students have asked these similar questions
show all steps
Most people know that the probability of getting a head when you flip a fair coin is . You want to use the relative frequency of the event to show that the probability is . How many times should you simulate flipping the coin in the experiment? Would it be better to use 300 trials or 3000 trials? Explain.
The qualified applicant pool for eight management trainee positions consists of ten women and six men. How many different groups of applicants can be selected for the positions
Chapter 12 Solutions
ELEMENTARY STATISTICS-MYLAB STAT.ACCESS
Ch. 12.1 - In Exercises 1-4, use the following listed arrival...Ch. 12.1 - In Exercises 1-4, use the following listed arrival...Ch. 12.1 - In Exercises 1-4, use the following listed arrival...Ch. 12.1 - In Exercises 1-4, use the following listed arrival...Ch. 12.1 - In Exercises 5-16, use analysis of variance for...Ch. 12.1 - In Exercises 5-16, use analysis of variance for...Ch. 12.1 - In Exercises 5-16, use analysis of variance for...Ch. 12.1 - In Exercises 5-16, use analysis of variance for...Ch. 12.1 - In Exercises 5-16, use analysis of variance for...Ch. 12.1 - Prob. 10BSC
Ch. 12.1 - Triathlon Times Jeff Parent is a statistics...Ch. 12.1 - Arsenic in Rice Listed below are amounts of...Ch. 12.1 - Prob. 13BSCCh. 12.1 - Speed Dating Listed below are attribute ratings of...Ch. 12.1 - In Exercises 15 and 16, use the data set in...Ch. 12.1 - In Exercises 15 and 16, use the data set in...Ch. 12.1 - Tukey Test A display of the Bonferroni test...Ch. 12.2 - Two-Way ANOVA The pulse rates in Table 12-3 from...Ch. 12.2 - Two-Way ANOVA If we have a goal of using the data...Ch. 12.2 - Interaction a. What is an interaction between two...Ch. 12.2 - Balanced Design Does the table given in Exercise 1...Ch. 12.2 - Pulse Rates If we use the data given in Exercise 1...Ch. 12.2 - Weights The weights (kg) in the following table...Ch. 12.2 - Heights The heights (cm) in the following table...Ch. 12.2 - Pancake Experiment Listed below are ratings of...Ch. 12.2 - Marathon Times Listed below are New York City...Ch. 12.2 - Smoking, Gender, and Body Temperature The table...Ch. 12.2 - Transformations of Data Example 1 illustrated the...Ch. 12 - Cola Weights Data Set 26 Cola Weights and Volumes...Ch. 12 - Cola Weights For the four samples described in...Ch. 12 - Cola Weights For the analysis of variance test...Ch. 12 - Cola Weights Identify the value of the test...Ch. 12 - Cola Weights The displayed results from Exercise 1...Ch. 12 - One-Way ANOVA In general, what is one-way analysis...Ch. 12 - One vs. Two What is the fundamental difference...Ch. 12 - Estimating Length Given below is a Minitab display...Ch. 12 - Estimating Length Using the same results displayed...Ch. 12 - Estimating Length Using the same results displayed...Ch. 12 - Speed Dating Data Set 18 Speed Dating in Appendix...Ch. 12 - Author Readability Pages were randomly selected by...Ch. 12 - Prob. 3RECh. 12 - Speed Dating Listed below are attribute ratings of...Ch. 12 - In Exercises 1-5, refer to the following list of...Ch. 12 - In Exercises 1-5, refer to the following list of...Ch. 12 - In Exercises 1-5, refer to the following list of...Ch. 12 - In Exercises 15, refer to the following list of...Ch. 12 - In Exercises 15, refer to the following list of...Ch. 12 - Quarters Assume that weights of quarters minted...Ch. 12 - Job Priority Survey USA Today reported on an...Ch. 12 - Win 4 Lottery Shown below is a histogram of digits...Ch. 12 - Does Weight Change with Age? Refer to Data Set 1...
Knowledge Booster


Learn more about
Need a deep-dive on the concept behind this application? Look no further. Learn more about this topic, statistics and related others by exploring similar questions and additional content below.Similar questions
- You want to make a salad from whatever vegetable you have in the fridge. You have seven different tomatoes. There are 2 red tomatoes, 4 yellow tomatoes, and one black tomato in the fridge. You have three different bell peppers. There is 1 red pepper, 1 yellow pepper, and 1 green pepper. What is the probability of randomly choosing a vegetable and getting a red tomato, and a green pepper? Round your answer to four decimal places.arrow_forwarduppose automobile insurance companies gave annual premiums for top-rated companies in several states. The figure below shows box plots for the annual premium for urban customers in three states. Which state offers the lowest premium? Which state offers the highest premium?arrow_forwardWing Foot is a shoe franchise commonly found in shopping centers across the United States. Wing Foot knows that its stores will not show a profit unless they gross over $940,000 per year. Let A be the event that a new Wing Foot store grosses over $940,000 its first year. Let B be the event that a store grosses over $940,000 its second year. Wing Foot has an administrative policy of closing a new store if it does not show a profit in either of the first two years. Assume that the accounting office at Wing Foot provided the following information: 58% of all Wing Foot stores show a profit the first year; 72% of all Wing Foot store show a profit the second year (this includes stores that did not show a profit the first year); however, 86% of Wing Foot stores that showed a profit the first year also showed a profit the second year. Compute P(B|Ac). Round your answer to the nearest hundredth.arrow_forward
- You draw two cards from a standard deck of 52 cards, but before you draw the second card, you put the first one back and reshuffle the deck. If you get a3on the first card, find the probability of drawing a 3 for the second card.arrow_forwardDo bonds reduce the overall risk of an investment portfolio? Let x be a random variable representing annual percent return for the Vanguard Total Stock Index (all Stocks). Let y be a random variable representing annual return for the Vanguard Balanced Index (60% stock and 40% bond). For the past several years, assume the following data. Compute the coefficient of variation for each fund. Round your answers to the nearest tenth. x: 14 0 37 21 35 23 24 -14 -14 -17 y: 8 -2 29 17 22 17 17 -2 -3 -8arrow_forwardWhat percentage of the general U.S. population have bachelor's degrees? Suppose that the Statistical Abstract of the United States, 120th Edition, gives the following percentage of bachelor’s degrees by state. For convenience, the data are sorted in increasing order. 17 18 18 18 19 20 20 20 21 21 21 21 21 22 22 22 22 22 23 23 24 24 24 24 24 25 25 25 25 26 26 26 26 26 26 27 27 27 28 28 28 29 29 31 31 32 32 34 35 38 Illinois has a bachelor's degree percentage rate of about 18%. Into what quartile does this rate fall?arrow_forward
- What percentage of the general U.S. population have bachelor's degrees? Suppose that the Statistical Abstract of the United States, 120th Edition, gives the following percentage of bachelor’s degrees by state. For convenience, the data are sorted in increasing order. 17 18 18 18 19 20 20 20 21 21 21 21 21 22 22 22 22 22 23 23 24 24 24 24 24 25 25 25 25 26 26 26 26 26 26 27 27 27 28 28 28 29 29 31 31 32 32 34 35 38 Illinois has a bachelor's degree percentage rate of about 18%. Into what quartile does this rate fall?arrow_forwardFind the range for the following sample data. x 23 17 11 30 27arrow_forwardDo bonds reduce the overall risk of an investment portfolio? Let x be a random variable representing annual percent return for the Vanguard Total Stock Index (all Stocks). Let y be a random variable representing annual return for the Vanguard Balanced Index (60% stock and 40% bond). For the past several years, assume the following data. Compute the sample mean for x and for y. Round your answer to the nearest tenth. x: 11 0 36 22 34 24 25 -11 -11 -22 y: 9 -3 28 14 23 16 14 -3 -4 -9arrow_forward
- Do bonds reduce the overall risk of an investment portfolio? Let x be a random variable representing annual percent return for the Vanguard Total Stock Index (all Stocks). Let y be a random variable representing annual return for the Vanguard Balanced Index (60% stock and 40% bond). For the past several years, assume the following data. Compute the range for variable y. X 12 0 36 21 35 23 24 -12 -12 -21 Y 10 -2 26 15 22 18 15 -2 -3 -10arrow_forwardDo bonds reduce the overall risk of an investment portfolio? Let x be a random variable representing annual percent return for the Vanguard Total Stock Index (all Stocks). Let y be a random variable representing annual return for the Vanguard Balanced Index (60% stock and 40% bond). For the past several years, assume the following data. Compute the range for variable y. X 12 0 36 21 35 23 24 -12 -12 -21 Y 10 -2 26 15 22 18 15 -2 -3 -10arrow_forwardDo bonds reduce the overall risk of an investment portfolio? Let x be a random variable representing annual percent return for the Vanguard Total Stock Index (all Stocks). Let y be a random variable representing annual return for the Vanguard Balanced Index (60% stock and 40% bond). For the past several years, assume the following data. Compute the range for variable x. X 15 0 37 23 33 25 26 -15 -15 -23 Y 6 -1 28 18 24 17 18 -1 -2 -6arrow_forward
arrow_back_ios
SEE MORE QUESTIONS
arrow_forward_ios
Recommended textbooks for you
 Glencoe Algebra 1, Student Edition, 9780079039897...AlgebraISBN:9780079039897Author:CarterPublisher:McGraw Hill
 Holt Mcdougal Larson Pre-algebra: Student Edition...AlgebraISBN:9780547587776Author:HOLT MCDOUGALPublisher:HOLT MCDOUGAL
 Big Ideas Math A Bridge To Success Algebra 1: Stu...AlgebraISBN:9781680331141Author:HOUGHTON MIFFLIN HARCOURTPublisher:Houghton Mifflin Harcourt
Glencoe Algebra 1, Student Edition, 9780079039897...
Algebra
ISBN:9780079039897
Author:Carter
Publisher:McGraw Hill
Holt Mcdougal Larson Pre-algebra: Student Edition...
Algebra
ISBN:9780547587776
Author:HOLT MCDOUGAL
Publisher:HOLT MCDOUGAL
Big Ideas Math A Bridge To Success Algebra 1: Stu...
Algebra
ISBN:9781680331141
Author:HOUGHTON MIFFLIN HARCOURT
Publisher:Houghton Mifflin Harcourt
Introduction to experimental design and analysis of variance (ANOVA); Author: Dr. Bharatendra Rai;https://www.youtube.com/watch?v=vSFo1MwLoxU;License: Standard YouTube License, CC-BY