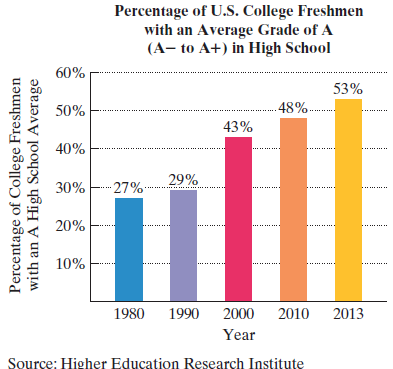
Grade Inflation. The bar graph shows the percentage of U.S. college freshmen with an average grade of A in high school. The data displayed by the bar graph can be described by the mathematical model p = 4 x 5 + 25 , where x is the number of years after 1980 and p is the percentage of U.S. college freshmen who had an average grade of A in high school. Use this information to solve Exercises 97-98 . a. According to the formula, in 2010, what percentage of U.S. college freshmen had an average grade of A in high school? Does this underestimate or overestimate the percent displayed by the bar graph? By how much? b. If trends shown by the formula continue, project when 57% of U.S. college freshmen will have had an average grade of A in high school.
Grade Inflation. The bar graph shows the percentage of U.S. college freshmen with an average grade of A in high school. The data displayed by the bar graph can be described by the mathematical model p = 4 x 5 + 25 , where x is the number of years after 1980 and p is the percentage of U.S. college freshmen who had an average grade of A in high school. Use this information to solve Exercises 97-98 . a. According to the formula, in 2010, what percentage of U.S. college freshmen had an average grade of A in high school? Does this underestimate or overestimate the percent displayed by the bar graph? By how much? b. If trends shown by the formula continue, project when 57% of U.S. college freshmen will have had an average grade of A in high school.
Solution Summary: The author calculates the percentage of U.S. college freshmen that had an average grade of A in high school in 2010.
Grade Inflation.The bar graph shows the percentage of U.S. college freshmen with an average grade of A in high school.
The data displayed by the bar graph can be described by the mathematical model
p
=
4
x
5
+
25
,
where x is the number of years after 1980 and p is the percentage of U.S. college freshmen who had an average grade of A in high school. Use this information to solve Exercises 97-98.
a. According to the formula, in 2010, what percentage of U.S. college freshmen had an average grade of A in high school? Does this underestimate or overestimate the percent displayed by the bar graph? By how much?
b. If trends shown by the formula continue, project when 57% of U.S. college freshmen will have had an average grade of A in high school.
A research study in the year 2009 found that there were 2760 coyotes
in a given region. The coyote population declined at a rate of 5.8%
each year.
How many fewer coyotes were there in 2024 than in 2015?
Explain in at least one sentence how you solved the problem. Show
your work. Round your answer to the nearest whole number.
Answer the following questions related to the following matrix
A =
3
³).
Explain the following terms
Chapter 1 Solutions
MyLab Math with Pearson eText -- Standalone Access Card -- for Algebra and Trigonometry (6th Edition)
Need a deep-dive on the concept behind this application? Look no further. Learn more about this topic, algebra and related others by exploring similar questions and additional content below.
Linear Equation | Solving Linear Equations | What is Linear Equation in one variable ?; Author: Najam Academy;https://www.youtube.com/watch?v=tHm3X_Ta_iE;License: Standard YouTube License, CC-BY


 Glencoe Algebra 1, Student Edition, 9780079039897...AlgebraISBN:9780079039897Author:CarterPublisher:McGraw Hill
 Big Ideas Math A Bridge To Success Algebra 1: Stu...AlgebraISBN:9781680331141Author:HOUGHTON MIFFLIN HARCOURTPublisher:Houghton Mifflin Harcourt
 Mathematics For Machine TechnologyAdvanced MathISBN:9781337798310Author:Peterson, John.Publisher:Cengage Learning,
 Elementary AlgebraAlgebraISBN:9780998625713Author:Lynn Marecek, MaryAnne Anthony-SmithPublisher:OpenStax - Rice University
 Holt Mcdougal Larson Pre-algebra: Student Edition...AlgebraISBN:9780547587776Author:HOLT MCDOUGALPublisher:HOLT MCDOUGAL
 Trigonometry (MindTap Course List)TrigonometryISBN:9781337278461Author:Ron LarsonPublisher:Cengage Learning