Concept explainers
Videos
(a)
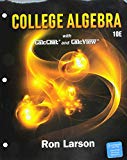
The intercepts of the red line graphically, and interpret the meaning of each intercept.
The
Explanation:
Consider the linear model.
For subsidy,
Here,
For total income,
The provided graph is:
By observing the graph, it can be estimated that the red line cuts the
The
Hence, the
(b)
To calculate: The intercepts of the red line algebraically.
The
Calculation:
Consider the provided graph.
The red line represents,
Upon substituting
Thus, the
Now, substitute
Thus, the
Hence, the
(c)
The earned income for which the total income is
The earned income for which the total income is
Explanation:
Consider the provided graph.
The blue line represents the Total Income,
Observe the graph below.

Hence, the earned income for which the total income is
(d)
To calculate: The earned income when the total income is
The earned income for which the total income is
Calculation:
Consider the linear model for total income,
Substitute
Check:
Substitute
Thus, it is true.
Hence, the earned income for which the total income is
Want to see the full answer?
Check out a sample textbook solution
Chapter 1 Solutions
Bundle: College Algebra, Loose-leaf Version, 10th + WebAssign Printed Access Card for Larson's College Algebra, 10th Edition, Single-Term


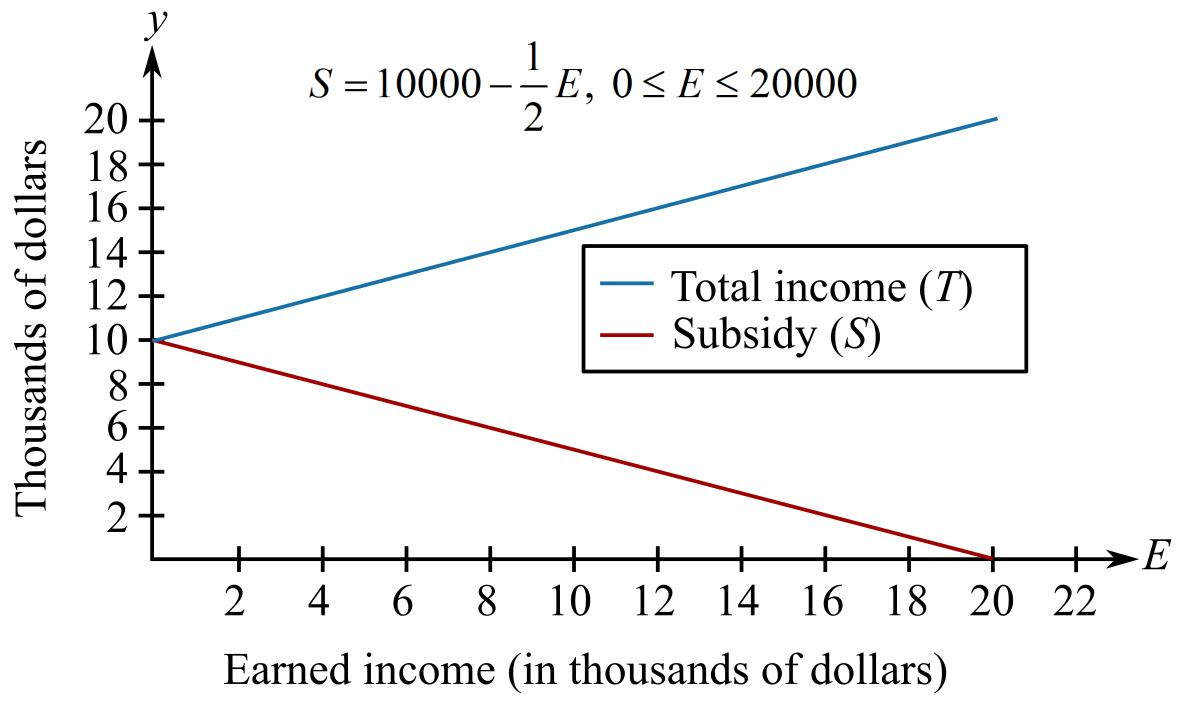
- How to solve 2542/64.132arrow_forwardAssume that you fancy polynomial splines, while you actually need ƒ(t) = e²/3 – 1 for t€ [−1, 1]. See the figure for a plot of f(t). Your goal is to approximate f(t) with an inter- polating polynomial spline of degree d that is given as sa(t) = • Σk=0 Pd,k bd,k(t) so that sd(tk) = = Pd,k for tk = −1 + 2 (given d > 0) with basis functions bd,k(t) = Σi±0 Cd,k,i = • The special case of d 0 is trivial: the only basis function b0,0 (t) is constant 1 and so(t) is thus constant po,0 for all t = [−1, 1]. ...9 The d+1 basis functions bd,k (t) form a ba- sis Bd {ba,o(t), ba,1(t), bd,d(t)} of the function space of all possible sα (t) functions. Clearly, you wish to find out, which of them given a particular maximal degree d is the best-possible approximation of f(t) in the least- squares sense. _ 1 0.9 0.8 0.7 0.6 0.5 0.4 0.3 0.2 0.1 0 -0.1 -0.2 -0.3 -0.4 -0.5 -0.6 -0.7 -0.8 -0.9 -1 function f(t) = exp((2t)/3) - 1 to project -1 -0.9 -0.8 -0.7 -0.6 -0.5 -0.4 -0.3 -0.2 -0.1 0 0.1 0.2 0.3 0.4 0.5…arrow_forwardAn image processor considered a 750×750 pixels large subset of an image and converted it into gray-scale, resulting in matrix gIn - a false-color visualization of gIn is shown in the top-left below. He prepared a two-dim. box filter f1 as a 25×25 matrix with only the 5×5 values in the middle being non-zero – this filter is shown in the top-middle position below. He then convolved £1 with itself to get £2, before convolving £2 with itself to get f3. In both of the steps, he maintained the 25×25 size. Next, he convolved gIn with £3 to get gl. Which of the six panels below shows g1? Argue by explaining all the steps, so far: What did the image processor do when preparing ₤3? What image processing operation (from gin to g1) did he prepare and what's the effect that can be seen? Next, he convolved the rows of f3 with filter 1/2 (-1, 8, 0, -8, 1) to get f4 - you find a visualization of filter f 4 below. He then convolved gIn with f4 to get g2 and you can find the result shown below. What…arrow_forward
- 3ur Colors are enchanting and elusive. A multitude of color systems has been proposed over a three-digits number of years - maybe more than the number of purposes that they serve... - Everyone knows the additive RGB color system – we usually serve light-emitting IT components like monitors with colors in that system. Here, we use c = (r, g, b) RGB with r, g, bЄ [0,1] to describe a color c. = T For printing, however, we usually use the subtractive CMY color system. The same color c becomes c = (c, m, y) CMY (1-c, 1-m, 1-y) RGB Note how we use subscripts to indicate with coordinate system the coordinates correspond to. Explain, why it is not possible to find a linear transformation between RGB and CMY coordinates. Farbenlehr c von Goethe Erster Band. Roſt einen Defte mit fergen up Tübingen, is et 3. Cotta'fden Babarblung. ISIO Homogeneous coordinates give us a work-around: If we specify colors in 4D, instead, with the 4th coordinate being the homogeneous coordinate h so that every actual…arrow_forwardCan someone provide an answer & detailed explanation please? Thank you kindly!arrow_forwardGiven the cubic function f(x) = x^3-6x^2 + 11x- 6, do the following: Plot the graph of the function. Find the critical points and determine whether each is a local minimum, local maximum, or a saddle point. Find the inflection point(s) (if any).Identify the intervals where the function is increasing and decreasing. Determine the end behavior of the graph.arrow_forward
- Given the quadratic function f(x) = x^2-4x+3, plot the graph of the function and find the following: The vertex of the parabola .The x-intercepts (if any). The y-intercept. Create graph also before solve.arrow_forwardwhat model best fits this dataarrow_forwardRound as specified A) 257 down to the nearest 10’s place B) 650 to the nearest even hundreds, place C) 593 to the nearest 10’s place D) 4157 to the nearest hundreds, place E) 7126 to the nearest thousand place arrow_forward
- Estimate the following products in two different ways and explain each method  A) 52x39 B) 17x74 C) 88x11 D) 26x42arrow_forwardFind a range estimate for these problems A) 57x1924 B) 1349x45 C) 547x73951arrow_forwardDraw the image of the following figure after a dilation centered at the origin with a scale factor of 14 退 14 12- 10 5- + Z 6 的 A X 10 12 14 16 18 G min 3 5arrow_forward
 Trigonometry (MindTap Course List)TrigonometryISBN:9781337278461Author:Ron LarsonPublisher:Cengage Learning
 Algebra & Trigonometry with Analytic GeometryAlgebraISBN:9781133382119Author:SwokowskiPublisher:Cengage
 Algebra for College StudentsAlgebraISBN:9781285195780Author:Jerome E. Kaufmann, Karen L. SchwittersPublisher:Cengage Learning
 Intermediate AlgebraAlgebraISBN:9781285195728Author:Jerome E. Kaufmann, Karen L. SchwittersPublisher:Cengage Learning
 Glencoe Algebra 1, Student Edition, 9780079039897...AlgebraISBN:9780079039897Author:CarterPublisher:McGraw Hill