Mathematics for the Trades: A Guided Approach (11th Edition) (What's New in Trade Math)
11th Edition
ISBN: 9780134756967
Author: Hal Saunders, Robert Carman
Publisher: PEARSON
expand_more
expand_more
format_list_bulleted
Concept explainers
Videos
Textbook Question
Chapter 12, Problem 7FPS
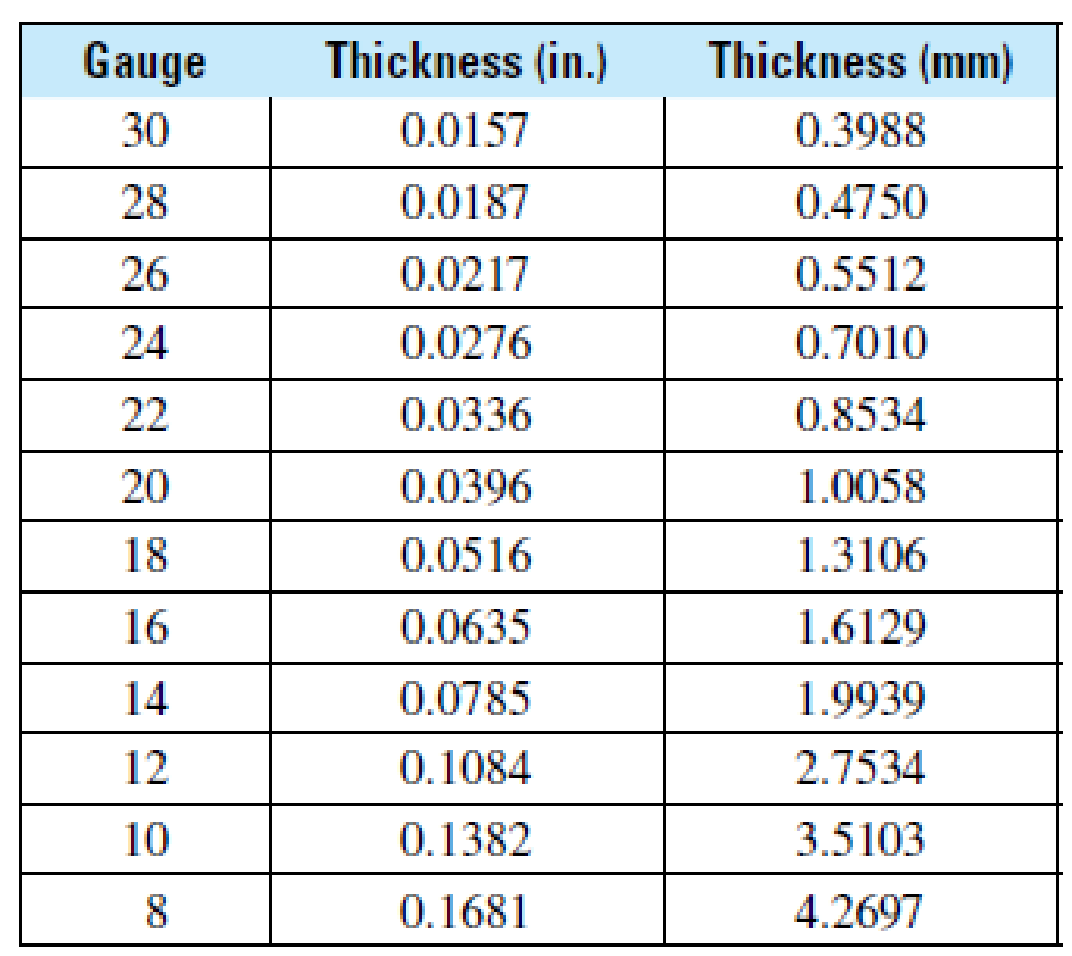
Sheet Metal Trades The following data represent the gauges of the sheet metal used by a sheet metal worker during his last eight jobs:
28 GA 12 GA 16 GA 24 GA 22 GA 18 GA 30 GA 8 GA
- (a) Use the chart at the top of page 846 to find the median thickness for these jobs in inches.
- (b) Use the chart to find the mean thickness of the gauges used in millimeters.
- (c) Use the chart to find the range of thicknesses of the gauges used in millimeters.
Expert Solution & Answer
Want to see the full answer?
Check out a sample textbook solution
Students have asked these similar questions
5. Let X be a positive random variable with finite variance, and let A = (0, 1).
Prove that
P(X AEX) 2 (1-A)² (EX)²
EX2
6. Let, for p = (0, 1), and xe R. X be a random variable defined as follows:
P(X=-x) = P(X = x)=p. P(X=0)= 1-2p.
Show that there is equality in Chebyshev's inequality for X.
This means that Chebyshev's inequality, in spite of being rather crude, cannot be
improved without additional assumptions.
4. Prove that, for any random variable X, the minimum of EIX-al is attained for
a = med (X).
Chapter 12 Solutions
Mathematics for the Trades: A Guided Approach (11th Edition) (What's New in Trade Math)
Ch. 12.1 - Solve: 0.82=x100Ch. 12.1 - Prob. 2LCCh. 12.1 - Automotive Trades The following bar graph shows...Ch. 12.1 - Trades Management The following graph shows the...Ch. 12.1 - General Interest The following double bar graph...Ch. 12.1 - General Interest The following stacked bar graph...Ch. 12.1 - Allied Health When Dr. Friedrich began working at...Ch. 12.1 - Automotive Trades The following line graph shows...Ch. 12.1 - Construction The following double-line graph...Ch. 12.1 - General Interest Study the circle graph at the top...
Ch. 12.1 - Prob. 9AECh. 12.1 - Allied Health An assistant at a pharmaceutical...Ch. 12.1 - Fire Protection Plot the following data as a bar...Ch. 12.1 - Transportation The following table lists the total...Ch. 12.1 - Metalworking Draw a bar graph from the following...Ch. 12.1 - Trades Management Plot the following data as a bar...Ch. 12.1 - Construction Plot the following data as a double...Ch. 12.1 - General Interest The following table shows the...Ch. 12.1 - Automotive Trades The following table shows the...Ch. 12.1 - Trades Management The following table shows the...Ch. 12.1 - General Interest The following table shows, by...Ch. 12.1 - Agriculture The following table shows the price...Ch. 12.1 - Allied Health The following table shows the...Ch. 12.1 - General Interest The following data show the U.S....Ch. 12.1 - Fire Protection The following data show the number...Ch. 12.1 - General Interest The following table shows the...Ch. 12.1 - Hydrology The following table shows the daily...Ch. 12.1 - Business and Finance Plot a double broken-line...Ch. 12.1 - Electrical Engineering Plot the following data as...Ch. 12.1 - Water/Wastewater Treatment The following table...Ch. 12.1 - Aviation An aircraft mechanic spends 12.5% of a...Ch. 12.1 - General Interest Recent surveys have shown that...Ch. 12.2 - Find the average of these numbers: 6, 8, 12, 14Ch. 12.2 - What number is halfway between 12 and 15?Ch. 12.2 - Find the mean, median, and mode for each set of...Ch. 12.2 - A. Find the mean, median, and mode for each set of...Ch. 12.2 - A. Find the mean, median, and mode for each set of...Ch. 12.2 - A. Find the mean, median, and mode for each set of...Ch. 12.2 - A. Find the mean, median, and mode for each set of...Ch. 12.2 - A. Find the mean, median, and mode for each set of...Ch. 12.2 - A. Find the mean, median, and mode for each set of...Ch. 12.2 - A. Find the mean, median, and mode for each set of...Ch. 12.2 - Construct an extended frequency distribution for...Ch. 12.2 - Construct an extended frequency distribution for...Ch. 12.2 - Aviation BF Goodrich produces brake pads for...Ch. 12.2 - General Trades The U.S. Department of Labor...Ch. 12.2 - Forestry The following table shows both the total...Ch. 12.2 - Water/Wastewater Treatment The seven-day mean of...Ch. 12.2 - Automotive Trades A mechanic has logged the...Ch. 12.2 - Forestry A forest ranger wishes to determine the...Ch. 12.2 - Hydrology The following table shows the monthly...Ch. 12.2 - Meteorology The National Weather Service provides...Ch. 12.2 - Automotive Trades The following table shows both...Ch. 12.2 - Hydrology The following table shows the daily...Ch. 12.2 - Allied Health The Apgar score is widely used to...Ch. 12.2 - Allied Health A pharmacist keeps careful track of...Ch. 12.2 - Prob. 13CECh. 12.2 - Prob. 14CECh. 12.3 - Calculate: 65 72.5Ch. 12.3 - Calculate: (2.5)2Ch. 12.3 - Prob. 1AECh. 12.3 - Prob. 2AECh. 12.3 - Prob. 3AECh. 12.3 - Calculate the range and the standard deviation for...Ch. 12.3 - Prob. 5AECh. 12.3 - Calculate the range and the standard deviation for...Ch. 12.3 - Prob. 7AECh. 12.3 - Prob. 8AECh. 12.3 - Prob. 1BECh. 12.3 - Prob. 2BECh. 12.3 - Prob. 3BECh. 12.3 - Calculate the standard deviation of the grouped...Ch. 12.3 - Prob. 1CECh. 12.3 - For each set of data, (a) calculate the standard...Ch. 12.3 - Prob. 1DECh. 12.3 - For each set of data, (a) calculate the standard...Ch. 12.3 - Prob. 1EECh. 12.3 - Prob. 2EECh. 12.3 - Prob. 3EECh. 12.3 - Prob. 4EECh. 12.3 - Prob. 5EECh. 12.3 - Prob. 6EECh. 12.3 - Prob. 7EECh. 12.3 - Prob. 8EECh. 12.3 - Prob. 9EECh. 12.3 - Prob. 10EECh. 12.3 - Prob. 11EECh. 12.3 - Prob. 12EECh. 12.3 - Prob. 13EECh. 12.3 - Automotive Trades In testing the acceleration from...Ch. 12 - Read bar graphs, line graphs, and circle graphs....Ch. 12 - Prob. 2PCh. 12 - Prob. 3PCh. 12 - Prob. 4PCh. 12 - Prob. 5PCh. 12 - Prob. 6PCh. 12 - Graph I Electrical Trades In general, as amps...Ch. 12 - Graph I Electrical Trades What is the minimum size...Ch. 12 - Graph I Electrical Trades What is the minimum wire...Ch. 12 - Prob. 4APSCh. 12 - Prob. 5APSCh. 12 - How many grams of fat are contained in a Peanut...Ch. 12 - How many grams of sugar are contained in a...Ch. 12 - How many grams of fat would you consume if you ate...Ch. 12 - How many grams of sugar would you consume if you...Ch. 12 - How many more grams of fat are in two Caramel...Ch. 12 - How many more grams of sugar are in three Peanut...Ch. 12 - Which cookie appears to be the healthiest (as...Ch. 12 - Which cookie appears to be the least healthy (as...Ch. 12 - By what percent does the amount of fat in a...Ch. 12 - By what percent does the amount of sugar in a...Ch. 12 - Retail Merchandising A small computer store is...Ch. 12 - Retail Merchandising A small computer store is...Ch. 12 - Retail Merchandising A small computer store is...Ch. 12 - Retail Merchandising A small computer store is...Ch. 12 - In September, what was the ratio of computer...Ch. 12 - Retail Merchandising A small computer store is...Ch. 12 - Retail Merchandising A small computer store is...Ch. 12 - Retail Merchandising A small computer store is...Ch. 12 - Graph IV Automotive Trades What was the cost per...Ch. 12 - Graph IV Automotive Trades When was the next time...Ch. 12 - Graph IV Automotive Trades During which time...Ch. 12 - Graph IV Automotive Trades During which time...Ch. 12 - Graph IV Automotive Trades What was the difference...Ch. 12 - Graph IV Automotive Trades By what percent did the...Ch. 12 - Graph IV Automotive Trades How much more did it...Ch. 12 - Graph V Business and Finance What was the actual...Ch. 12 - Graph V Business and Finance What was the...Ch. 12 - Graph V Business and Finance During which month...Ch. 12 - Graph V Business and Finance During which month...Ch. 12 - Graph V Business and Finance During which month...Ch. 12 - Graph V Business and Finance During which month...Ch. 12 - Graph V Business and Finance During which months...Ch. 12 - Graph V Business and Finance During which month...Ch. 12 - Graph VI Metalworking What percent of marine...Ch. 12 - Graph VI Metalworking What percent of this alloy...Ch. 12 - Graph VI Metalworking Without measuring, calculate...Ch. 12 - Graph VI Metalworking How many ounces of zinc are...Ch. 12 - Graph VI Metalworking How many grams of bismuth...Ch. 12 - Prob. 1BPSCh. 12 - General Interest The following table shows the...Ch. 12 - Prob. 3BPSCh. 12 - Prob. 4BPSCh. 12 - Prob. 5BPSCh. 12 - Prob. 6BPSCh. 12 - Metalworking Construct a circle graph based on the...Ch. 12 - Fire Protection Construct a circle graph based on...Ch. 12 - General Interest Students in a community college...Ch. 12 - C. Find the mean, median, and mode for each set of...Ch. 12 - C. Find the mean, median, and mode for each set of...Ch. 12 - C. Find the mean, median, and mode for each set of...Ch. 12 - C. Find the mean, median, and mode for each set of...Ch. 12 - Prob. 5CPSCh. 12 - C. Find the mean, median, and mode for each set of...Ch. 12 - D. Calculate (a) the range and (b) the standard...Ch. 12 - D. Calculate (a) the range and (b) the standard...Ch. 12 - Prob. 3DPSCh. 12 - Prob. 4DPSCh. 12 - E. Calculate the mean and the standard deviation...Ch. 12 - Prob. 2EPSCh. 12 - Prob. 1FPSCh. 12 - Meteorology The following table shows the average...Ch. 12 - Agriculture The following data from the United...Ch. 12 - Industrial Technology The Energy Information...Ch. 12 - Police Science To determine the speed that a...Ch. 12 - Agriculture The following list of numbers...Ch. 12 - Sheet Metal Trades The following data represent...Ch. 12 - Prob. 8FPSCh. 12 - Prob. 9FPS
Knowledge Booster


Learn more about
Need a deep-dive on the concept behind this application? Look no further. Learn more about this topic, subject and related others by exploring similar questions and additional content below.Similar questions
- 8. Recall, from Sect. 2.16.4, the likelihood ratio statistic, Ln, which was defined as a product of independent, identically distributed random variables with mean 1 (under the so-called null hypothesis), and the, sometimes more convenient, log-likelihood, log L, which was a sum of independent, identically distributed random variables, which, however, do not have mean log 1 = 0. (a) Verify that the last claim is correct, by proving the more general statement, namely that, if Y is a non-negative random variable with finite mean, then E(log Y) log(EY). (b) Prove that, in fact, there is strict inequality: E(log Y) < log(EY), unless Y is degenerate. (c) Review the proof of Jensen's inequality, Theorem 5.1. Generalize with a glimpse on (b).arrow_forward2. Derive the component transformation equations for tensors shown be- low where [C] = [BA] is the direction cosine matrix from frame A to B. B[T] = [C]^[T][C]T 3. The transport theorem for vectors shows that the time derivative can be constructed from two parts: the first is an explicit frame-dependent change of the vector whereas the second is an active rotational change of the vector. The same holds true for tensors. Starting from the previous result, derive a version of transport theorem for tensors. [C] (^[T])[C] = dt d B dt B [T] + [WB/A]B[T] – TWB/A] (10 pt) (7pt)arrow_forwardUse the graph of the function y = f (x) to find the value, if possible. f(x) 8 7 6 Q5 y 3 2 1 x -8 -7 -6 -5 -4 -3 -2 -1 1 2 3 4 5 6 7 8 -1 -2 -3 -4 -5 -6 -7 -8+ Olim f(z) x-1+ O Limit does not exist.arrow_forward
- 3. Prove that, for any random variable X, the minimum of E(X - a)² is attained for a = EX. Provedarrow_forwardShade the areas givenarrow_forward7. Cantelli's inequality. Let X be a random variable with finite variance, o². (a) Prove that, for x ≥ 0, P(X EX2x)≤ 02 x² +0² 202 P(|X - EX2x)<≤ (b) Find X assuming two values where there is equality. (c) When is Cantelli's inequality better than Chebyshev's inequality? (d) Use Cantelli's inequality to show that med (X) - EX ≤ o√√3; recall, from Proposition 6.1, that an application of Chebyshev's inequality yields the bound o√√2. (e) Generalize Cantelli's inequality to moments of order r 1.arrow_forward
- The college hiking club is having a fundraiser to buy new equipment for fall and winter outings. The club is selling Chinese fortune cookies at a price of $2 per cookie. Each cookie contains a piece of paper with a different number written on it. A random drawing will determine which number is the winner of a dinner for two at a local Chinese restaurant. The dinner is valued at $32. Since fortune cookies are donated to the club, we can ignore the cost of the cookies. The club sold 718 cookies before the drawing. Lisa bought 13 cookies. Lisa's expected earnings can be found by multiplying the value of the dinner by the probability that she will win. What are Lisa's expected earnings? Round your answer to the nearest cent.arrow_forwardThe Honolulu Advertiser stated that in Honolulu there was an average of 659 burglaries per 400,000 households in a given year. In the Kohola Drive neighborhood there are 321 homes. Let r be the number of homes that will be burglarized in a year. Use the formula for Poisson distribution. What is the value of p, the probability of success, to four decimal places?arrow_forwardThe college hiking club is having a fundraiser to buy new equipment for fall and winter outings. The club is selling Chinese fortune cookies at a price of $2 per cookie. Each cookie contains a piece of paper with a different number written on it. A random drawing will determine which number is the winner of a dinner for two at a local Chinese restaurant. The dinner is valued at $32. Since fortune cookies are donated to the club, we can ignore the cost of the cookies. The club sold 718 cookies before the drawing. Lisa bought 13 cookies. Lisa's expected earnings can be found by multiplying the value of the dinner by the probability that she will win. What are Lisa's expected earnings? Round your answer to the nearest cent.arrow_forward
- What was the age distribution of nurses in Great Britain at the time of Florence Nightingale? Thanks to Florence Nightingale and the British census of 1851, we have the following information (based on data from the classic text Notes on Nursing, by Florence Nightingale). Note: In 1851 there were 25,466 nurses in Great Britain. Furthermore, Nightingale made a strict distinction between nurses and domestic servants. Use a histogram and graph the probability distribution. Using the graph of the probability distribution determine the probability that a British nurse selected at random in 1851 would be 40 years of age or older. Round your answer to nearest thousandth. Age range (yr) 20–29 30–39 40–49 50–59 60–69 70–79 80+ Midpoint (x) 24.5 34.5 44.5 54.5 64.5 74.5 84.5 Percent of nurses 5.7% 9.7% 19.5% 29.2% 25.0% 9.1% 1.8%arrow_forwardWhat was the age distribution of nurses in Great Britain at the time of Florence Nightingale? Thanks to Florence Nightingale and the British census of 1851, we have the following information (based on data from the classic text Notes on Nursing, by Florence Nightingale). Note: In 1851 there were 25,466 nurses in Great Britain. Furthermore, Nightingale made a strict distinction between nurses and domestic servants. Use a histogram and graph the probability distribution. Using the graph of the probability distribution determine the probability that a British nurse selected at random in 1851 would be 40 years of age or older. Round your answer to nearest thousandth. Age range (yr) 20–29 30–39 40–49 50–59 60–69 70–79 80+ Midpoint (x) 24.5 34.5 44.5 54.5 64.5 74.5 84.5 Percent of nurses 5.7% 9.7% 19.5% 29.2% 25.0% 9.1% 1.8%arrow_forwardThere are 4 radar stations and the probability of a single radar station detecting an enemy plane is 0.55. Make a histogram for the probability distribution.arrow_forward
arrow_back_ios
SEE MORE QUESTIONS
arrow_forward_ios
Recommended textbooks for you
 Holt Mcdougal Larson Pre-algebra: Student Edition...AlgebraISBN:9780547587776Author:HOLT MCDOUGALPublisher:HOLT MCDOUGAL
 Big Ideas Math A Bridge To Success Algebra 1: Stu...AlgebraISBN:9781680331141Author:HOUGHTON MIFFLIN HARCOURTPublisher:Houghton Mifflin Harcourt
 Glencoe Algebra 1, Student Edition, 9780079039897...AlgebraISBN:9780079039897Author:CarterPublisher:McGraw Hill
 Functions and Change: A Modeling Approach to Coll...AlgebraISBN:9781337111348Author:Bruce Crauder, Benny Evans, Alan NoellPublisher:Cengage Learning
 College Algebra (MindTap Course List)AlgebraISBN:9781305652231Author:R. David Gustafson, Jeff HughesPublisher:Cengage Learning
Holt Mcdougal Larson Pre-algebra: Student Edition...
Algebra
ISBN:9780547587776
Author:HOLT MCDOUGAL
Publisher:HOLT MCDOUGAL
Big Ideas Math A Bridge To Success Algebra 1: Stu...
Algebra
ISBN:9781680331141
Author:HOUGHTON MIFFLIN HARCOURT
Publisher:Houghton Mifflin Harcourt
Glencoe Algebra 1, Student Edition, 9780079039897...
Algebra
ISBN:9780079039897
Author:Carter
Publisher:McGraw Hill
Functions and Change: A Modeling Approach to Coll...
Algebra
ISBN:9781337111348
Author:Bruce Crauder, Benny Evans, Alan Noell
Publisher:Cengage Learning
College Algebra (MindTap Course List)
Algebra
ISBN:9781305652231
Author:R. David Gustafson, Jeff Hughes
Publisher:Cengage Learning
The Shape of Data: Distributions: Crash Course Statistics #7; Author: CrashCourse;https://www.youtube.com/watch?v=bPFNxD3Yg6U;License: Standard YouTube License, CC-BY
Shape, Center, and Spread - Module 20.2 (Part 1); Author: Mrmathblog;https://www.youtube.com/watch?v=COaid7O_Gag;License: Standard YouTube License, CC-BY
Shape, Center and Spread; Author: Emily Murdock;https://www.youtube.com/watch?v=_YyW0DSCzpM;License: Standard Youtube License