
Subpart (a):
Effect on Aggregate Demand and Supply.
Subpart (a):
Explanation of Solution
When consumers fear of an impending economic depression, their spending decline and they tend to save more. This leads to a decrease in AD curve. This can be explained by using figure 1.
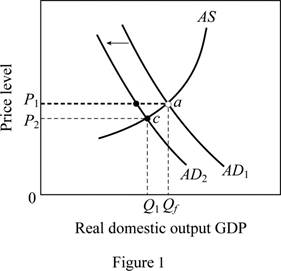
In figure 1, horizontal axis represents the real GDP(
Concept Introduction:
Aggregate demand (AD): Aggregate demand refers to the total value of the goods and services that are demanded at a particular price in a given period of time.
Subpart (b):
Effect on Aggregate Demand and Supply.
Subpart (b):
Explanation of Solution
When a new tax is imposed on producers, cost of production comes up and there is no incentive to produce more. This leads to a decline in
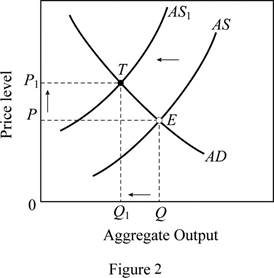
In figure 2, horizontal axis represents the real GDP and vertical axis represents price level. In this case, the AS curve shifts left (from AS to AS1), this moves the equilibrium position from E to T, thus there is a decline in the output (from Q to Q1) and a rise in the price level (from P to P1).
Concept Introduction:
Aggregate demand (AD): Aggregate demand refers to the total value of the goods and services that are demanded at a particular price in a given period of time.
Aggregate supply (AS): Aggregate supply refers to the total value of the goods and services that are available for purchase at a particular price in a given period of time.
Subpart (c):
Effect on Aggregate Demand and Supply.
Subpart (c):
Explanation of Solution
Figure 3 can explain the shift in AD curve due to reduction in interest rates at each price level. In figure 3, horizontal axis measures the real GDP and vertical axis measures the price level.
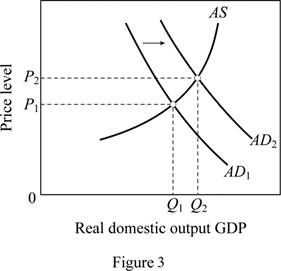
A reduction in interest rates decreases the borrowing cost increases the spending.
This leads to a rightward shift of AD curve from AD1 to AD2. Thus, it brings the output and price level up. The output increases from Q1 to Q2 and price level increases from P1 to P2.
Concept Introduction:
Aggregate demand (AD): Aggregate demand refers to the total value of the goods and services that are demanded at a particular price in a given period of time.
Aggregate supply (AS): Aggregate supply refers to the total value of the goods and services that are available for purchase at a particular price in a given period of time.
Subpart (d):
Effect on Aggregate Demand and Supply.
Subpart (d):
Explanation of Solution
A major increase in spending shifts the AD curve to right. Figure 4 is used to explain this situation. In figure 4, horizontal axis measures the real GDP and vertical axis measures the price level.
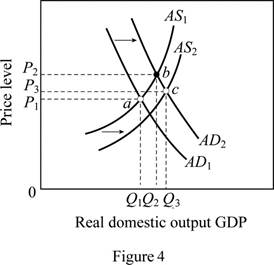
Government expenditure is a key determinant of changes in the aggregate demand. The increase in government spending (spending for health care) increases the aggregate demand leading to a shift of AD curve from AD1 to AD2. Any real improvements in healthcare resulting from the spending would ultimately increase the productivity, thereby shifting the AS curve to the right (from AS1 to AS2). The equilibrium moves from a to c leading to an increase in output (from Q1 to Q3) . It will also move the price level up from P1 to P3.
Concept Introduction:
Aggregate demand (AD): Aggregate demand refers to the total value of the goods and services that are demanded at a particular price in a given period of time.
Aggregate supply (AS): Aggregate supply refers to the total value of the goods and services that are available for purchase at a particular price in a given period of time.
Subpart (e):
Effect on Aggregate Demand and Supply.
Subpart (e):
Explanation of Solution
The general expectation of surging inflation in the near future will increase the aggregate demand today because the consumers will want to buy products before their prices escalate. This can be illustrated using figure 3. As a result, there will be a rightward shift of AD curve from AD1 to AD2 which brings the output and price level up. In figure 3, the output increases from Q1 to Q2 and price level increases from P1 to P2.
Concept Introduction:
Aggregate demand (AD): Aggregate demand refers to the total value of the goods and services that are demanded at a particular price in a given period of time.
Aggregate supply (AS): Aggregate supply refers to the total value of the goods and services that are available for purchase at a particular price in a given period of time.
Subpart (f):
Effect on Aggregate Demand and Supply.
Subpart (f):
Explanation of Solution
Figure 5 is used to explain this case. In figure 5, horizontal axis measures the real GDP and vertical axis measures the price level.
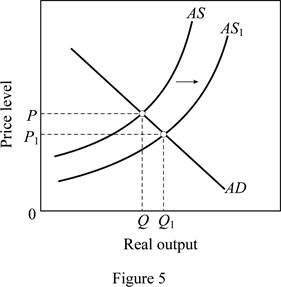
As oil prices fall (oil is an imported resource) due to the disintegration of OPEC, it increases the U.S. aggregate supply. As a result, there will be a rightward shift of AS curve from AS to AS1. This brings the output level up from Q to Q1 and price level down from P to P1.
Concept Introduction:
Aggregate demand (AD): Aggregate demand refers to the total value of the goods and services that are demanded at a particular price in a given period of time.
Aggregate supply (AS): Aggregate supply refers to the total value of the goods and services that are available for purchase at a particular price in a given period of time.
Subpart (g):
Effect on Aggregate Demand and Supply.
Subpart (g):
Explanation of Solution
A reduction in the personal income tax rates raises take-home income increases consumer purchases at each possible price level. This is illustrated in figure 3. Tax cuts shift the aggregate demand curve to the right from AD1 to AD2 which brings the output and price level up. In figure 3, the output increases from Q1 to Q2 and price level increases from P1 to P2.
Concept Introduction:
Aggregate demand (AD): Aggregate demand refers to the total value of the goods and services that are demanded at a particular price in a given period of time.
Aggregate supply (AS): Aggregate supply refers to the total value of the goods and services that are available for purchase at a particular price in a given period of time.
Subpart (h):
Effect on Aggregate Demand and Supply.
Subpart (h):
Explanation of Solution
The sizable increase the labor productivity with no change in nominal wages will increase the overall productivity as more output is available for the given input. This increases the aggregate supply thereby shifting the AS curve to the right from AS to AS1 (Refer Figure 5). This leads to an increase in output (from Q to Q1) and a decrease in price level from P to P1.
Concept Introduction:
Aggregate demand (AD): Aggregate demand refers to the total value of the goods and services that are demanded at a particular price in a given period of time.
Aggregate supply (AS): Aggregate supply refers to the total value of the goods and services that are available for purchase at a particular price in a given period of time.
Subpart (i):
Effect on Aggregate Demand and Supply.
Subpart (i):
Explanation of Solution
This case can be explained using Figure 2. When there is an increase in nominal wages with no change in productivity, it increases per unit cost of production. This force the AS curve to shift left (from AS to AS1). The equilibrium position moves from E to T, thus there are a decline in the output (from Q to Q1) and a rise in the price level (from P to P1).
Concept Introduction:
Aggregate demand (AD): Aggregate demand refers to the total value of the goods and services that are demanded at a particular price in a given period of time.
Aggregate supply (AS): Aggregate supply refers to the total value of the goods and services that are available for purchase at a particular price in a given period of time.
Subpart (j):
Effect on Aggregate Demand and Supply.
Subpart (j):
Explanation of Solution
Figure 6 shows the impact of increasing demand and decreasing supply.
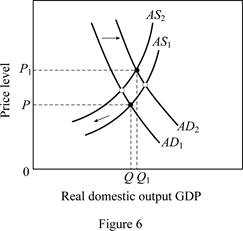
Figure 6 is used to explain this condition. The horizontal axis in Figure 6 measures the real domestic output whereas price level is measured by the vertical axis. A rise in net exports (higher exports relative to imports) shifts the aggregate demand curve to the right (from AD1 to AD2). But, due to the higher input prices, per unit cost is more, leading to a shift of the aggregate supply curve to the left from AS1 to AS2. This leads to an increase in output from Q to Q1 along with an increase in price level from P to P1.
Concept Introduction:
Aggregate demand (AD): Aggregate demand refers to the total value of the goods and services that are demanded at a particular price in a given period of time.
Aggregate supply (AS): Aggregate supply refers to the total value of the goods and services that are available for purchase at a particular price in a given period of time.
Want to see more full solutions like this?
Chapter 12 Solutions
MACROECONOMICS (LL)

- 5. Download the Excel sheet from Brightspace. The data contains the GDP per capita and GNI per capita of OECD member countries in 2014 (both figures are reported in US dollars). The countries are ranked by GDP per capita. a. Compute the ratio of GNI to GDP for each country (GNI per capita/GDP per capita). What does this imply about net factor income from abroad for each country? b. Rank the countries based on the GNI/GDP ratio, starting with the country with the highest ratio and ending with the country with the lowest ratio. Which country has the highest ratio, and which has the lowest? c. Comment on why the countries you identified in the previous question have a large difference between GDP and GNI? What does the difference imply?arrow_forward3. Answer the following questions about external wealth. a. Home has external wealth of $100 million in period t. In t+1, Home purchases $160 million foreign assets, and Foreign purchases $120 million in Home assets. Assume a world interest rate of 10% per annum. Compute the "change" in external wealth at t+1 for Home. b. A country's external wealth was -$1.5 billion at the end of 2015, and its trade balance was $750 million in 2016. Assume the world interest rate is 5% per annum. What is the "value" of a country's external wealth at the end of 2016?arrow_forward1. The table below shows a country's hypothetical national income and product accounts data. Category Consumption (personal consumption expenditures) Investment (gross private domestic investment) Government consumption (government expenditures) Exports Imports Net Factor Income from Abroad Net unilateral transfers Billions of Dollars 8,000 1,300 2,100 900 1,750 +45 -20 a. Compute the following accounts using the information in the table: Gross national expenditure (GNE) . Trade balance (TB) • Gross domestic product (GDP) • Gross national income (GNI) . Gross national disposable income (GNDI) Current account (CA) b. Derive the current account identity using the national income identity. Are savings greater than or smaller than investment in this country? The national income identity is: GNDIGNE + CA, GNE = C + G + I.arrow_forward
- 4. Assume that a country produces an output Q of 50 every year. The world interest rate is 10%. Consumption C is 50 every year, and I = G = 0. There is an unexpected drop in output in year 0, so output falls to 28 and is then expected to return to 50 in every future year. If the country desires to smooth consumption, how much should it borrow in period 0? What will the new level of consumption be from then on?arrow_forward2. Show how each of the following would affect the following US balance of payments: trade balance (TB), net factor income abroad (NFIA), net unilateral transfers (NUT), financial account (FA), and capital account (KA). Identify which specific account is affected in each case (e.g., +$10 in TB). Note that the sum of the balance of payment accounts is zero. Example: A California computer manufacturer purchases a $50 hard disk from a Malaysian company, paying the funds from a bank account in Malaysia. Answer: The US imports a hard disk from Malaysia: TB = $50 The US draws a foreign asset to pay for the import (less external asset): FA = +$50. (Note: The balance of payment identity holds: CA + FA (+KA) = −- $50 + $50 = 0. No KA in this example.) a. A US tourist in Japan sells his iPod to a local resident for yen worth $100. (hint: A US tourist obtains Japanese currency.) b. A US owner of Honda shares receives $10,000 in dividend payments, which are paid into a Tokyo bank. c. The central…arrow_forwardMark's Pizza Enter George's Pizza Stay Out Advertise $50, -$2 $175, $0 Do Not Advertise $150, $15 $100, $0 In their quest to maximize combined total profits, Mark and George's Pizzas find themselves at a critical juncture. As they carefully evaluate the potential outcomes and weigh their strategic options, the future of Moncton's pizza industry hangs in the balance. Let's imagine both players are analyzing the payoff matrix seeking the optimal combination of actions that will yield the highest collective profit. What actions maximize their combined total profits? a. Mark's Pizza to "Advertise" and George's Pizza to "Stay Out". b. Mark's Pizza to "Do Not Advertise" and George's Pizza to "Stay Out" C. Mark's Pizza to Do Not Advertise" and George's Pizza to "Enter" d. Mark's Pizza to "Advertise" and George's Pizza to "Enter"arrow_forward
- With your team I would like you to complete the following questions after please post your replies and we will discuss in class Choose a financial instrument or market (such as stocks, bonds, insurance, cash, gold, bitcoin). Explain how investments work for the individual investor mainly yourself. With the current market upheaval and uncertainty what would you and your team consider the best options for investment. Consider the idea of short term investing vs long term investing, laddering, safe haven, liquidity, and risk) Consider Roth IRA vs traditional IRA, ETF's, CD's, Mutual Funds. Always consider taxes and inflation your return should always be greater then inflation and taxes.arrow_forwardShort Description Fiscal Policy Graph Details Shown is a Fiscal Policy diagram with the variable Real GDP (billions of dollars) on the x-axis and the variable Price Level on the y-axis. The x-axis is scaled from 0 to 800 billion dollars with an increment of 40 billion dollars, and the y-axis is scaled from 30 to 150 units with an increment of 5 units. Object Details On the graph we have:Four Line Objects:An upward sloping Aggregate Supply, AS line with two endpoints:Point 1 at (160, 70)Point 2 at (720, 140)A downward sloping Aggregate Demand, AD1 line with two endpoints:Point 1 at (80, 110)Point 2 at (640, 40)A vertical Long-run Aggregate Supply, LRAS with two endpoints:Point 1 at (400, 145)Point 2 at (400, 30)A downward sloping Aggregate Demand, AD line with two endpoints:Point 1 at (720, 60)Point 2 at (160, 130)Two Reference Points:Lines AS, AD, and LRAS intersect at (400, 100)Lines AS and AD1 intersect at (280, 85) a. How much does aggregate demand need to change to restore the…arrow_forwardFiscal Policy Graph Details Shown is a Fiscal Policy diagram with the variable Real GDP (billions of dollars) on the x-axis and the variable Price Level on the y-axis. The x-axis is scaled from 0 to 1000 billion dollars with an increment of 50 billion dollars, and the y-axis is scaled from 0 to 180 units with an increment of 10 units. Object Details On the graph we have:Four Line Objects:An upward sloping Aggregate Supply, AS line with two endpoints:Point 1 at (200, 40)Point 2 at (800, 160)A downward sloping Aggregate Demand, AD line with two endpoints:Point 1 at (200, 160)Point 2 at (800, 40)A downward sloping Aggregate Demand, AD1 line with two endpoints:Point 1 at (350, 170)Point 2 at (900, 60)A vertical Long-run Aggregate Supply, LRAS line with two endpoints:Point 1 at (500, 170)Point 2 at (500, 0)Two Reference Points:Lines AS and AD1 intersect at (600, 120)Lines AS, AD, and LRAS intersect at (500, 100) a. How much does aggregate demand need to change to restore the…arrow_forward
- a. How much does aggregate demand need to change to restore the economy to its long-run equilibrium? $ billion b. If the MPC is 0.6, how much does government purchases need to change to shift aggregate demand by the amount you found in part a? $ billion Suppose instead that the MPC is 0.95. c. How much does aggregate demand and government purchases need to change to restore the economy to its long-run equilibrium? Aggregate demand needs to change by $ billion and government purchases need to change by $ billion.arrow_forwardPrice P 1. Explain the distinction between outputs and outcomes in social service delivery 2. Discuss the Rawlsian theory of justice and briefly comment on its relevance to the political economy of South Africa. [2] [7] 3. Redistributive expenditure can take the form of direct cash transfers (grants) and/or in- kind subsidies. With references to the graphs below, discuss the merits of these two transfer types in the presence and absence of a positive externality. [6] 9 Quantity (a) P, MC, MB MSB MPB+MEB MPB P-MC MEB Quantity (6) MCarrow_forwardDon't use ai to answer I will report you answerarrow_forward
 Essentials of Economics (MindTap Course List)EconomicsISBN:9781337091992Author:N. Gregory MankiwPublisher:Cengage Learning
 Principles of Economics (MindTap Course List)EconomicsISBN:9781305585126Author:N. Gregory MankiwPublisher:Cengage Learning
 Principles of Macroeconomics (MindTap Course List)EconomicsISBN:9781285165912Author:N. Gregory MankiwPublisher:Cengage Learning
 Brief Principles of Macroeconomics (MindTap Cours...EconomicsISBN:9781337091985Author:N. Gregory MankiwPublisher:Cengage Learning
 Principles of Economics, 7th Edition (MindTap Cou...EconomicsISBN:9781285165875Author:N. Gregory MankiwPublisher:Cengage Learning
 Principles of Macroeconomics (MindTap Course List)EconomicsISBN:9781305971509Author:N. Gregory MankiwPublisher:Cengage Learning