
Mathematical Statistics with Applications
7th Edition
ISBN: 9780495110811
Author: Dennis Wackerly, William Mendenhall, Richard L. Scheaffer
Publisher: Cengage Learning
expand_more
expand_more
format_list_bulleted
Concept explainers
Videos
Textbook Question
Chapter 1.2, Problem 5E
Given here is the relative frequency histogram associated with grade point averages (GPAs) of a sample of 30 students:
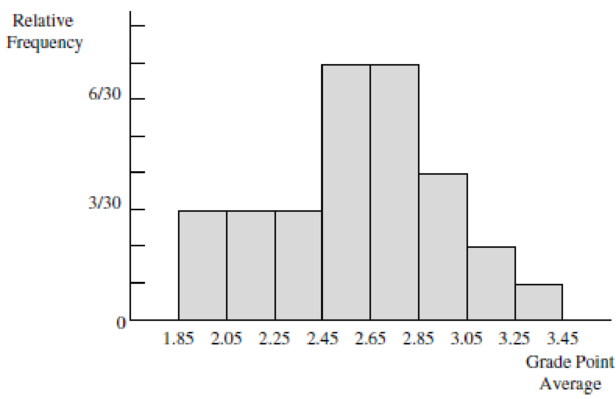
- a Which of the GPA categories identified on the horizontal axis are associated with the largest proportion of students?
- b What proportion of students had GPAs in each of the categories that you identified?
- c What proportion of the students had GPAs less than 2.65?
Expert Solution & Answer

Trending nowThis is a popular solution!

Students have asked these similar questions
Should you be confident in applying your regression equation to estimate the heart rate of a python at 35°C? Why or why not?
Given your fitted regression line, what would be the residual for snake #5 (10 C)?
Calculate the 95% confidence interval around your estimate of r using Fisher’s z-transformation. In your final answer, make sure to back-transform to the original units.
Chapter 1 Solutions
Mathematical Statistics with Applications
Ch. 1.1 - For each of the following situations, identify the...Ch. 1.2 - Are some cities more windy than others? Does...Ch. 1.2 - Of great importance to residents of central...Ch. 1.2 - The top 40 stocks on the over-the-counter (OTC)...Ch. 1.2 - Given here is the relative frequency histogram...Ch. 1.2 - The relative frequency histogram given next was...Ch. 1.2 - The self-reported heights of 105 students in a...Ch. 1.2 - An article in Archaeometry presented an analysis...Ch. 1.3 - Resting breathing rates for college-age students...Ch. 1.3 - It has been projected that the average and...
Ch. 1.3 - The following results on summations will help us...Ch. 1.3 - Prob. 12ECh. 1.3 - Prob. 13ECh. 1.3 - Refer to Exercise 1.3 and repeat parts (a) and (b)...Ch. 1.3 - Refer to Exercise 1.4 and repeat parts (a) and (b)...Ch. 1.3 - Prob. 16ECh. 1.3 - Prob. 17ECh. 1.3 - Prob. 18ECh. 1.3 - Prob. 19ECh. 1.3 - Prob. 20ECh. 1.3 - The manufacturer of a new food additive for beef...Ch. 1 - Prove that the sum of the deviations of a set of...Ch. 1 - The mean duration of television commercials is 75...Ch. 1 - Aqua running has been suggested as a method of...Ch. 1 - The following data give the lengths of time to...Ch. 1 - Prob. 26SECh. 1 - Prob. 27SECh. 1 - The discharge of suspended solids from a phosphate...Ch. 1 - Prob. 29SECh. 1 - Compared to their stay-at-home peers, women...Ch. 1 - Prob. 31SECh. 1 - Prob. 32SECh. 1 - Prob. 33SECh. 1 - Prob. 34SECh. 1 - Prob. 35SECh. 1 - Prob. 36SECh. 1 - Prob. 37SECh. 1 - Prob. 38SE
Knowledge Booster


Learn more about
Need a deep-dive on the concept behind this application? Look no further. Learn more about this topic, statistics and related others by exploring similar questions and additional content below.Similar questions
- BUSINESS DISCUSSarrow_forwardA researcher wishes to estimate, with 90% confidence, the population proportion of adults who support labeling legislation for genetically modified organisms (GMOs). Her estimate must be accurate within 4% of the true proportion. (a) No preliminary estimate is available. Find the minimum sample size needed. (b) Find the minimum sample size needed, using a prior study that found that 65% of the respondents said they support labeling legislation for GMOs. (c) Compare the results from parts (a) and (b). ... (a) What is the minimum sample size needed assuming that no prior information is available? n = (Round up to the nearest whole number as needed.)arrow_forwardThe table available below shows the costs per mile (in cents) for a sample of automobiles. At a = 0.05, can you conclude that at least one mean cost per mile is different from the others? Click on the icon to view the data table. Let Hss, HMS, HLS, Hsuv and Hмy represent the mean costs per mile for small sedans, medium sedans, large sedans, SUV 4WDs, and minivans respectively. What are the hypotheses for this test? OA. Ho: Not all the means are equal. Ha Hss HMS HLS HSUV HMV B. Ho Hss HMS HLS HSUV = μMV Ha: Hss *HMS *HLS*HSUV * HMV C. Ho Hss HMS HLS HSUV =μMV = = H: Not all the means are equal. D. Ho Hss HMS HLS HSUV HMV Ha Hss HMS HLS =HSUV = HMVarrow_forward
- Question: A company launches two different marketing campaigns to promote the same product in two different regions. After one month, the company collects the sales data (in units sold) from both regions to compare the effectiveness of the campaigns. The company wants to determine whether there is a significant difference in the mean sales between the two regions. Perform a two sample T-test You can provide your answer by inserting a text box and the answer must include: Null hypothesis, Alternative hypothesis, Show answer (output table/summary table), and Conclusion based on the P value. (2 points = 0.5 x 4 Answers) Each of these is worth 0.5 points. However, showing the calculation is must. If calculation is missing, the whole answer won't get any credit.arrow_forwardBinomial Prob. Question: A new teaching method claims to improve student engagement. A survey reveals that 60% of students find this method engaging. If 15 students are randomly selected, what is the probability that: a) Exactly 9 students find the method engaging?b) At least 7 students find the method engaging? (2 points = 1 x 2 answers) Provide answers in the yellow cellsarrow_forwardIn a survey of 2273 adults, 739 say they believe in UFOS. Construct a 95% confidence interval for the population proportion of adults who believe in UFOs. A 95% confidence interval for the population proportion is ( ☐, ☐ ). (Round to three decimal places as needed.)arrow_forward
arrow_back_ios
SEE MORE QUESTIONS
arrow_forward_ios
Recommended textbooks for you
 Big Ideas Math A Bridge To Success Algebra 1: Stu...AlgebraISBN:9781680331141Author:HOUGHTON MIFFLIN HARCOURTPublisher:Houghton Mifflin Harcourt
 Glencoe Algebra 1, Student Edition, 9780079039897...AlgebraISBN:9780079039897Author:CarterPublisher:McGraw Hill
 Holt Mcdougal Larson Pre-algebra: Student Edition...AlgebraISBN:9780547587776Author:HOLT MCDOUGALPublisher:HOLT MCDOUGAL
 Functions and Change: A Modeling Approach to Coll...AlgebraISBN:9781337111348Author:Bruce Crauder, Benny Evans, Alan NoellPublisher:Cengage Learning
Big Ideas Math A Bridge To Success Algebra 1: Stu...
Algebra
ISBN:9781680331141
Author:HOUGHTON MIFFLIN HARCOURT
Publisher:Houghton Mifflin Harcourt
Glencoe Algebra 1, Student Edition, 9780079039897...
Algebra
ISBN:9780079039897
Author:Carter
Publisher:McGraw Hill
Holt Mcdougal Larson Pre-algebra: Student Edition...
Algebra
ISBN:9780547587776
Author:HOLT MCDOUGAL
Publisher:HOLT MCDOUGAL
Functions and Change: A Modeling Approach to Coll...
Algebra
ISBN:9781337111348
Author:Bruce Crauder, Benny Evans, Alan Noell
Publisher:Cengage Learning
The Shape of Data: Distributions: Crash Course Statistics #7; Author: CrashCourse;https://www.youtube.com/watch?v=bPFNxD3Yg6U;License: Standard YouTube License, CC-BY
Shape, Center, and Spread - Module 20.2 (Part 1); Author: Mrmathblog;https://www.youtube.com/watch?v=COaid7O_Gag;License: Standard YouTube License, CC-BY
Shape, Center and Spread; Author: Emily Murdock;https://www.youtube.com/watch?v=_YyW0DSCzpM;License: Standard Youtube License