![Elementary Statistics with MyStatLab Access Code [With CDROM]](https://www.bartleby.com/isbn_cover_images/9780321890238/9780321890238_largeCoverImage.gif)
Elementary Statistics with MyStatLab Access Code [With CDROM]
12th Edition
ISBN: 9780321890238
Author: Mario F. Triola
Publisher: PEARSON
expand_more
expand_more
format_list_bulleted
Videos
Textbook Question
Chapter 12, Problem 5CRE
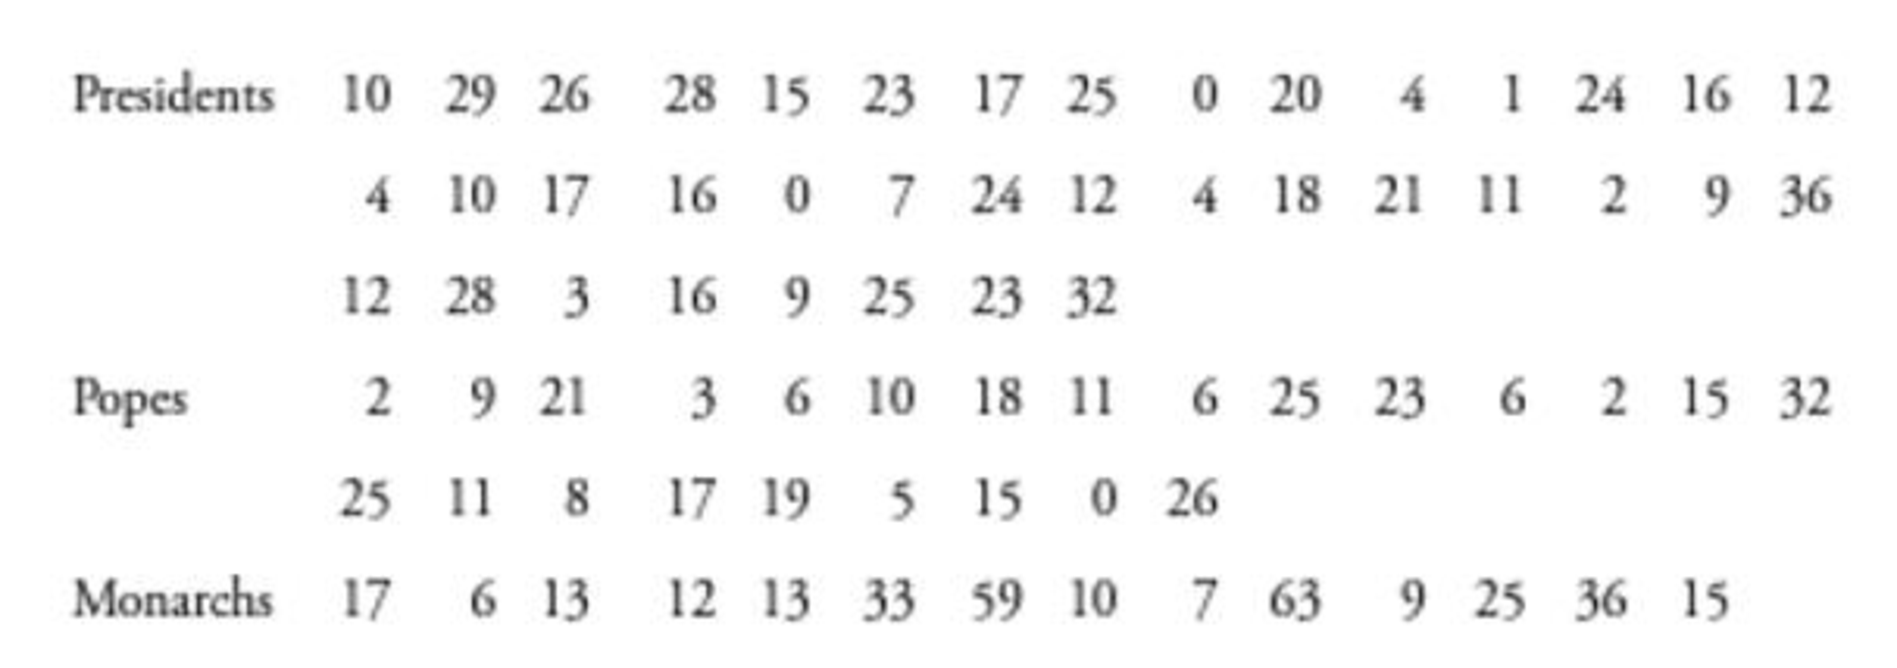
In Exercises 1-5, refer to the following list of numbers of years that U.S. presidents, popes, and British monarchs lived after their inauguration, election, or coronation, respectively. (As of this writing, the last president is Gerald Ford, the last pope is John Paul II, and the last British monarch is George VI.) Assume that the data are samples randomly selected from larger populations.
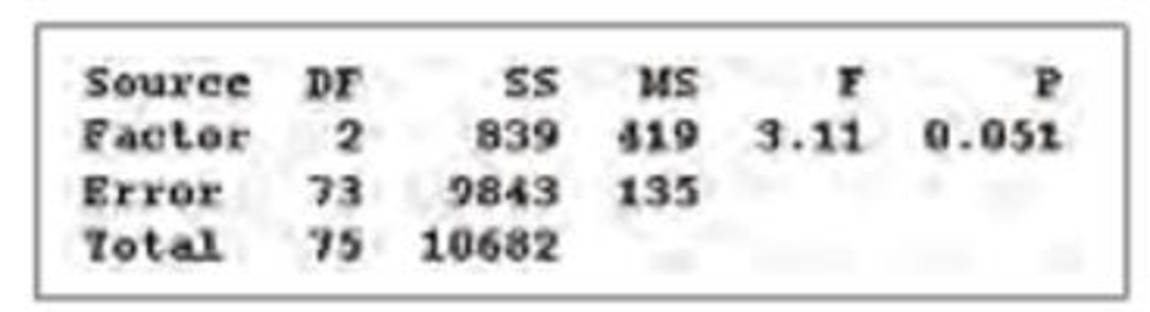
5. ANOVA The display below results from using the one-way analysis of variance test.
- a. What is the null hypothesis?
- b. Assuming a 0.05 significance level, what conclusion is indicated by the displayed results?
MINITAB
Expert Solution & Answer
Want to see the full answer?
Check out a sample textbook solution
Students have asked these similar questions
please find the answers for the yellows boxes using the information and the picture below
A marketing agency wants to determine whether different advertising platforms generate significantly different levels of customer engagement. The agency measures the average number of daily clicks on ads for three platforms: Social Media, Search Engines, and Email Campaigns. The agency collects data on daily clicks for each platform over a 10-day period and wants to test whether there is a statistically significant difference in the mean number of daily clicks among these platforms. Conduct ANOVA test.
You can provide your answer by inserting a text box and the answer must include: also please provide a step by on getting the answers in excel
Null hypothesis,
Alternative hypothesis,
Show answer (output table/summary table), and
Conclusion based on the P value.
A company found that the daily sales revenue of its flagship product follows a normal distribution with a mean of $4500 and a standard deviation of $450. The company defines a "high-sales day" that is, any day with sales exceeding $4800. please provide a step by step on how to get the answers
Q: What percentage of days can the company expect to have "high-sales days" or sales greater than $4800?
Q: What is the sales revenue threshold for the bottom 10% of days? (please note that 10% refers to the probability/area under bell curve towards the lower tail of bell curve)
Provide answers in the yellow cells
Chapter 12 Solutions
Elementary Statistics with MyStatLab Access Code [With CDROM]
Ch. 12.2 - In Exercises 1-4, use the following listed chest...Ch. 12.2 - Prob. 2BSCCh. 12.2 - In Exercises 1-4, use the following listed chest...Ch. 12.2 - Prob. 4BSCCh. 12.2 - In Exercises 516, use analysis of variance for the...Ch. 12.2 - In Exercises 516, use analysis of variance for the...Ch. 12.2 - Highway Fuel Consumption Data Set 14 in Appendix B...Ch. 12.2 - City Fuel Consumption Data Set 14 in Appendix B...Ch. 12.2 - Head Injury Crash Test Data Exercises 14 use chest...Ch. 12.2 - Pelvis Injury Crash Test Data Exercises 14 use...
Ch. 12.2 - Prob. 11BSCCh. 12.2 - Prob. 12BSCCh. 12.2 - Prob. 13BSCCh. 12.2 - Prob. 14BSCCh. 12.2 - Prob. 15BSCCh. 12.2 - Prob. 16BSCCh. 12.2 - Tukey Test A display of the Bonferroni test...Ch. 12.3 - Prob. 1BSCCh. 12.3 - Prob. 2BSCCh. 12.3 - Prob. 3BSCCh. 12.3 - Prob. 4BSCCh. 12.3 - Prob. 5BSCCh. 12.3 - Car Crash Tests The following table lists results...Ch. 12.3 - Prob. 7BSCCh. 12.3 - Prob. 8BSCCh. 12.3 - Self-Esteem The following table lists measures of...Ch. 12.3 - Prob. 10BSCCh. 12.3 - Prob. 11BBCh. 12 - Measures of Voltage The author measured voltage...Ch. 12 - Prob. 2CQQCh. 12 - Prob. 3CQQCh. 12 - Prob. 4CQQCh. 12 - Prob. 5CQQCh. 12 - Prob. 6CQQCh. 12 - Prob. 7CQQCh. 12 - Prob. 8CQQCh. 12 - Using the same results given in Exercise 8, does...Ch. 12 - Prob. 1RECh. 12 - Prob. 2RECh. 12 - Tar in Cigarettes Data Set 10 in Appendix B...Ch. 12 - Smoking, Body Temperature, Gender The table below...Ch. 12 - Prob. 1CRECh. 12 - Prob. 2CRECh. 12 - Prob. 3CRECh. 12 - Prob. 4CRECh. 12 - In Exercises 1-5, refer to the following list of...Ch. 12 - Freshman 15: Correlation/Regression listed below...Ch. 12 - Platelets: Normal Distribution Based on Data Set 1...Ch. 12 - Job Priority Survey USA Today reported about an...Ch. 12 - Prob. 9CRECh. 12 - Lottery: Goodness-of-Fit The bars in the histogram...Ch. 12 - Prob. 10CQQCh. 12 - Chocolate Chips Revisited The Chapter Problem for...
Knowledge Booster


Learn more about
Need a deep-dive on the concept behind this application? Look no further. Learn more about this topic, statistics and related others by exploring similar questions and additional content below.Similar questions
- Business Discussarrow_forwardThe following data represent total ventilation measured in liters of air per minute per square meter of body area for two independent (and randomly chosen) samples. Analyze these data using the appropriate non-parametric hypothesis testarrow_forwardeach column represents before & after measurements on the same individual. Analyze with the appropriate non-parametric hypothesis test for a paired design.arrow_forward
- Should you be confident in applying your regression equation to estimate the heart rate of a python at 35°C? Why or why not?arrow_forwardGiven your fitted regression line, what would be the residual for snake #5 (10 C)?arrow_forwardCalculate the 95% confidence interval around your estimate of r using Fisher’s z-transformation. In your final answer, make sure to back-transform to the original units.arrow_forward
arrow_back_ios
SEE MORE QUESTIONS
arrow_forward_ios
Recommended textbooks for you
 Glencoe Algebra 1, Student Edition, 9780079039897...AlgebraISBN:9780079039897Author:CarterPublisher:McGraw Hill
 Holt Mcdougal Larson Pre-algebra: Student Edition...AlgebraISBN:9780547587776Author:HOLT MCDOUGALPublisher:HOLT MCDOUGAL
 College Algebra (MindTap Course List)AlgebraISBN:9781305652231Author:R. David Gustafson, Jeff HughesPublisher:Cengage Learning
 Big Ideas Math A Bridge To Success Algebra 1: Stu...AlgebraISBN:9781680331141Author:HOUGHTON MIFFLIN HARCOURTPublisher:Houghton Mifflin Harcourt
Glencoe Algebra 1, Student Edition, 9780079039897...
Algebra
ISBN:9780079039897
Author:Carter
Publisher:McGraw Hill
Holt Mcdougal Larson Pre-algebra: Student Edition...
Algebra
ISBN:9780547587776
Author:HOLT MCDOUGAL
Publisher:HOLT MCDOUGAL
College Algebra (MindTap Course List)
Algebra
ISBN:9781305652231
Author:R. David Gustafson, Jeff Hughes
Publisher:Cengage Learning
Big Ideas Math A Bridge To Success Algebra 1: Stu...
Algebra
ISBN:9781680331141
Author:HOUGHTON MIFFLIN HARCOURT
Publisher:Houghton Mifflin Harcourt
Hypothesis Testing using Confidence Interval Approach; Author: BUM2413 Applied Statistics UMP;https://www.youtube.com/watch?v=Hq1l3e9pLyY;License: Standard YouTube License, CC-BY
Hypothesis Testing - Difference of Two Means - Student's -Distribution & Normal Distribution; Author: The Organic Chemistry Tutor;https://www.youtube.com/watch?v=UcZwyzwWU7o;License: Standard Youtube License