Source Natural Home and Garden CHECK POINT 5 Being aware of which appliances and activities inyour home use the most energy can help you make sound decisions thatallow you to decrease energy consumption and increase savings. Thecircle graph in Figure 1.4 shows how energy consumption is distributedthroughout a typical home. Suppose that last year your family spent $2148.72 on natural gas andelectricity. Assuming the circle graph in Figure 1.4 is representative ofyour family’s energy consumption. a. Use the appropriate information displayed by the graph todetermine a calculation that shows the amount your family spenton heating and cooling for the year. 0.48 × 24.48.72 b. Use rounding to find a reasonable estimate for this calculation. 0.5 × 2100 = 1050 Your family spent approximately $1050 on heeling end cooling lost year.
Source Natural Home and Garden CHECK POINT 5 Being aware of which appliances and activities inyour home use the most energy can help you make sound decisions thatallow you to decrease energy consumption and increase savings. Thecircle graph in Figure 1.4 shows how energy consumption is distributedthroughout a typical home. Suppose that last year your family spent $2148.72 on natural gas andelectricity. Assuming the circle graph in Figure 1.4 is representative ofyour family’s energy consumption. a. Use the appropriate information displayed by the graph todetermine a calculation that shows the amount your family spenton heating and cooling for the year. 0.48 × 24.48.72 b. Use rounding to find a reasonable estimate for this calculation. 0.5 × 2100 = 1050 Your family spent approximately $1050 on heeling end cooling lost year.
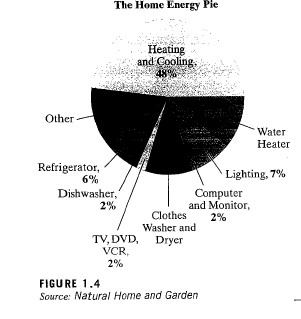
Solution Summary: The author explains how the circle graph shows that 48% of family's expenditure in on heating and cooling is determined by rounding.
CHECK POINT 5 Being aware of which appliances and activities inyour home use the most energy can help you make sound decisions thatallow you to decrease energy consumption and increase savings. Thecircle graph in Figure 1.4 shows how energy consumption is distributedthroughout a typical home.
Suppose that last year your family spent $2148.72 on natural gas andelectricity. Assuming the circle graph in Figure 1.4 is representative ofyour family’s energy consumption.
a. Use the appropriate information displayed by the graph todetermine a calculation that shows the amount your family spenton heating and cooling for the year.
0.48
×
24.48.72
b. Use rounding to find a reasonable estimate for this calculation.
0.5
×
2100
=
1050
Your family spent approximately $1050 on heeling end cooling lost year.
The fox population in a certain region has an annual growth rate of 8 percent per year. It is estimated that the
population in the year 2000 was 22600.
(a) Find a function that models the population t years after 2000 (t = 0 for 2000).
Your answer is P(t)
=
(b) Use the function from part (a) to estimate the fox population in the year 2008.
Your answer is (the answer should be an integer)
r
The solutions are 1
where x1 x2-
● Question 11
Solve: x 54
Give your answer as an interval.
Question 12
Chapter 1 Solutions
Thinking Mathematically, Books a la Carte Edition plus MyLab Math with Pearson eText -- Access Card Package, 4/e (7th Edition)
Need a deep-dive on the concept behind this application? Look no further. Learn more about this topic, subject and related others by exploring similar questions and additional content below.
Linear Equation | Solving Linear Equations | What is Linear Equation in one variable ?; Author: Najam Academy;https://www.youtube.com/watch?v=tHm3X_Ta_iE;License: Standard YouTube License, CC-BY


 Algebra & Trigonometry with Analytic GeometryAlgebraISBN:9781133382119Author:SwokowskiPublisher:Cengage
 College Algebra (MindTap Course List)AlgebraISBN:9781305652231Author:R. David Gustafson, Jeff HughesPublisher:Cengage Learning
 Glencoe Algebra 1, Student Edition, 9780079039897...AlgebraISBN:9780079039897Author:CarterPublisher:McGraw Hill
 Trigonometry (MindTap Course List)TrigonometryISBN:9781305652224Author:Charles P. McKeague, Mark D. TurnerPublisher:Cengage Learning
 Big Ideas Math A Bridge To Success Algebra 1: Stu...AlgebraISBN:9781680331141Author:HOUGHTON MIFFLIN HARCOURTPublisher:Houghton Mifflin Harcourt
 Algebra: Structure And Method, Book 1AlgebraISBN:9780395977224Author:Richard G. Brown, Mary P. Dolciani, Robert H. Sorgenfrey, William L. ColePublisher:McDougal Littell