Concept explainers
According to a Gallup poll, in 2012 almost a third of Americans named Iran their country’s greatest enemy. That number matched public sentiment in the United States toward Saddam Hussein’s Iraq at the time of the 2003 invasion. The line graphs show the percentage of Americans who considered either Iraq or Iran their country’s greatest enemy from 2001 through 2012. Use this information to solve Exercises 49-50.
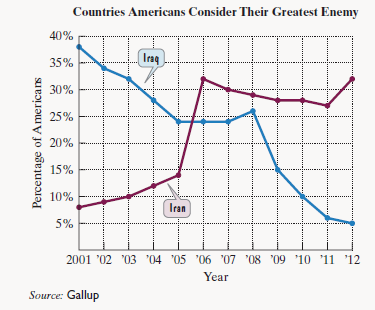
(In Exercises 49-50, refer to the graph at the bottom of the previous page.)
a. Find an estimate for the percentage of Americans who considered Iraq their country’s greatest enemy in 2001.
b. Between which two years did the percentage of Americans who considered Iraq their country’s greatest enemy decrease at the greatest rate?
c. In which year did 32% of Americans consider Iraq their country’s greatest enemy?
Want to see the full answer?
Check out a sample textbook solutionChapter 1 Solutions
Thinking Mathematically (6th Edition)
- The bar graph shows median yearly earnings of full-time workers in the United States for people 25 years and over with a college education, by final degree earned.The median yearly salary of an American whose final degreeis a doctorate is $45 thousand less than twice that of an American whose final degree is a bachelor’s. Combined,two people with each of these educational attainments earn $198 thousand. Find the median yearly salary of Americanswith each of these final degrees.arrow_forwardCollege students are graduating with the highest debt burden in history. The bar graph shows the mean, or average, student-loan debt in the United States for five selected graduating years from 2001 through 2013. Here are two mathematical models for the data shown by the graph. In each formula, D represents mean student-loan debt, in dollars, x years after 2000. The Model 1 is, D = 1188x + 16,218 and the Model 2 is D = 46x2 + 541x + 17,650. Solve, a. Which model better describes the data for 2001?b. Does the polynomial model of degree 2 underestimate or overestimate the mean student-loan debt for 2013? By how much?arrow_forwardThe bar graph below shows the percentage of people having different views on college education. In 2000, 24% of adults viewed a college education as essential for success. For the period 2000 through 2010, the percentage viewing a college education as essential for success increased on average by approximately 2.5 each year. If this trend continues, by which year will 64% of all adults view a college education as essential for success? 64% of adults will view a college education as essential for success by the year Changing Attitudes Towards College 60- A college 50 educato is available for qualified students. is essential for SUccess. 으 404 30- 10-24% 49% 35% 31% 0- 2000 2010 2000 2010 Help Me Solve This Textbook Get More Help - Clear All Skill Builder Check Answer 9:55 PM 73°F 9/13/2021 P Type here to search backspace 24 4. 7. 6. E R K pause Percentagearrow_forward
- The report, “The Older Population: 2010” also indicates that in 1900 approximately 4% of the U.S. population was made up of individuals who were 65 years or older, while in 2010 this same age group made up about 13% of the population. Write a complete sentence that describes the relative change in the percentage of people 65 years or older.arrow_forwardIn 2010, a new type of computer was introduced and approximately 20 million were sold. In 2011, the number sold increased by a factor of approximately 2.5. Assuming that the sales follow a linear trend through 2016, approximately how many of these computers will be sold in 2016? How many computers in millions?arrow_forwardThe data shown indicate the number of wins and the number of points scored for teams in a hockey league. Use a TI-83 Plus/TI-84 Plus calculator to construct the scatter plot. No. of wins, x 11 6 5 9 10 9 7 8 No. of points, y 15 26 29 20 16 18 24 23 Send data to Excel Part: 0 / 2 Part 1 of 2 Select the correct graph. Graph A Graph B y y 30+ 30 25 - 25 20- 20 15- 15 10- 10-arrow_forward
- A box office analyst seeks to predict opening weekend box office gross for movies. Toward this goal, the analyst plans to use online trailer views as a predictor. For each of the 66 movies, the number of online trailer views from the release of the trailer through the Saturday before a movie opens and the opening weekend box office gross (in millions of dollars) are collected and stored in the accompanying table. Complete the parts below.arrow_forwardTo investigate whether air temperature influences the age at which a baby learns to crawl, researchers conducted a study of 414 babies. The graph and accompanying statistics provide information about the average monthly temperature, in degrees Fahrenheit (F). when a baby was six months old and the average age, in weeks, when the baby first started to crawl. Temperature and Age Babies First Crawl 36 34 32 30 40 50 60 70 80 Average Monthly Temperature (°F) • The line of best fit: crawling age = -0.0777(temperature) +35.7 Correlation coefficient:-0.7 Average crawling age: 31.77 Which statement represents a valid conclusion and justification that the researchers can make as a result of the study? A. Since the correlation coefficient is less than 0, there is insufficient evidence to conclude causation or correlation for this study. Average Crawling Age (weeks)arrow_forwardOpinions are split about a coffee company's pumpkin-flavored coffee (PFC). Yet every year over the last five years the consumption of pumpkin-flavored goods has increased. If we look at the numbers, it also becomes clear why a leading coffee company keeps offering the PFC earlier and earlier every year. According to a magazine, the amount spent by PFC buyers at the coffee company is about 17% higher than non-PFC buyers. The accompanying table shows a random sample of eight consumers, the amount they spend per week, and the number of PFCs purchased per week. PFC Spending 2 13.88 7 39.11 4 19.79 1 9.84 3 15.43 1 21.52 5 37.39 3 13.85 Calculate the slope and y-intercept for the regression formula. The slope is b1=4.465 The y-intercept is b0=6.840 Provide an interpretation for the value of the slope. Because the slope is positive, it can be…arrow_forward
- Opinions are split about a coffee company's pumpkin-flavored coffee (PFC). Yet every year over the last five years the consumption of pumpkin-flavored goods has increased. If we look at the numbers, it also becomes clear why a leading coffee company keeps offering the PFC earlier and earlier every year. According to a magazine, the amount spent by PFC buyers at the coffee company is about 17% higher than non-PFC buyers. The accompanying table shows a random sample of eight consumers, the amount they spend per week, y, and the number of PFCs purchased, x, per week. PFC Spending 1 13.17 8 38.65 3 19.49 2 9.56 4 15.85 1 21.82 5 37.53 3 13.69 α=0.05 t= 3.07 p-value= 0.022 Construct a 95% confidence interval for the population slope. UCL = 6.69 LCL = 0.75 What conclusions about PFC purchases and spending can be drawn from these…arrow_forwardOpinions are split about a coffee company's pumpkin-flavored coffee (PFC). Yet every year over the last five years the consumption of pumpkin-flavored goods has increased. If we look at the numbers, it also becomes clear why a leading coffee company keeps offering the PFC earlier and earlier every year. According to a magazine, the amount spent by PFC buyers at the coffee company is about 17% higher than non-PFC buyers. The accompanying table shows a random sample of eight consumers, the amount they spend per week, y, and the number of PFCs purchased, x, per week. PFC Spending 1 13.17 8 38.65 3 19.49 2 9.56 4 15.85 1 21.82 5 37.53 3 13.69 α=0.05 Calculate the test statistic for the hypothesis test. t= (Round to two decimal places as needed.)arrow_forwardOpinions are split about a coffee company's pumpkin-flavored coffee (PFC). Yet every year over the last five years the consumption of pumpkin-flavored goods has increased. If we look at the numbers, it also becomes clear why a leading coffee company keeps offering the PFC earlier and earlier every year. According to a magazine, the amount spent by PFC buyers at the coffee company is about 17% higher than non-PFC buyers. The accompanying table shows a random sample of eight consumers, the amount they spend per week, and the number of PFCs purchased per week. PFC Spending 2 13.88 7 39.11 4 19.79 1 9.84 3 15.43 1 21.52 5 37.39 3 13.85 Calculate the slope and y-intercept for the regression formula. The slope is b1=(Round to three decimal places as needed.)arrow_forward
- Holt Mcdougal Larson Pre-algebra: Student Edition...AlgebraISBN:9780547587776Author:HOLT MCDOUGALPublisher:HOLT MCDOUGALGlencoe Algebra 1, Student Edition, 9780079039897...AlgebraISBN:9780079039897Author:CarterPublisher:McGraw Hill