
Videos
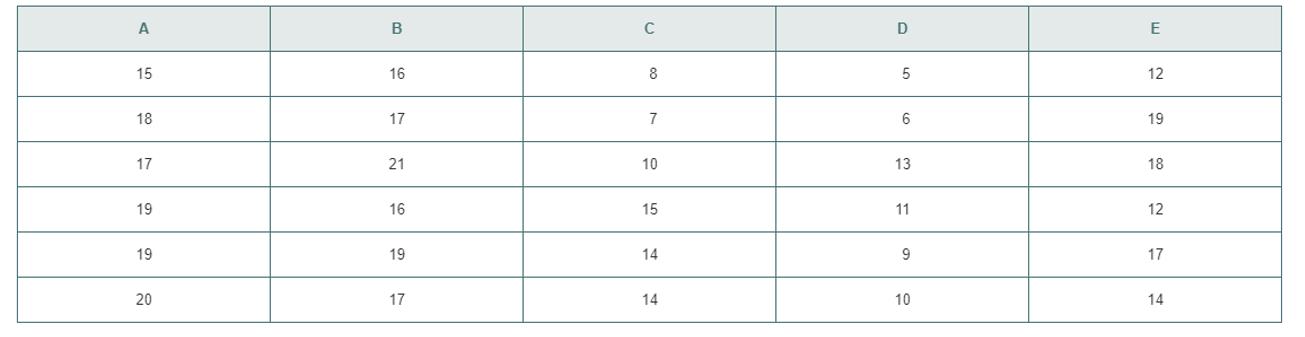
An advertising agency has been hired by a manufacturer of pens of develop an advertising campaign for the upcoming holiday season. To prepare for this project, the research director decided to initiate a study to the effect of advertising on product perception. An experiment is designed to compare five different advertisements. Advertisement A greatly undersells the pen’s characteristics. Advertisement B slightly undersells the pen’s characteristics. Advertisement oversells the pen’s characteristics.
Advertisement D greatly oversells the pen’s characteristics. Advertisement E Attempts to correctly state the pen’s characteristics.
A sample of 30 adult respondents, taken from a larger focus group, is randomly assigned to the five advertisements (so that there are six respondents to each). After reading the advertisement and developing a sense of product expectation, all respondents unknowingly receive the same pen to evaluate. The respondents are permitted to test the pen and the plausibility of the advertising copy. The respondents are then asked to rate the pen from 1 to 7 on the product characteristic scales of appearance, durability, and writing performance. The combined scores of three rating (appearance, durability, and writing performance) for the 30 respondents are stored in Pen. These data are:
a. At the 0.05 level of significance, is there evidence of a difference in the
b. Compare the results of (a) with those of Problem 11.10 (a) on page 413.
c. Which test is more appropriate for these data: the Kruskal-Wallis rank test or one-way ANPOVA F test? Explain.
Want to see the full answer?
Check out a sample textbook solution
Chapter 12 Solutions
Student Solutions Manual for Basic Business Statistics


- 9. The concentration function of a random variable X is defined as Qx(h) = sup P(x ≤ X ≤x+h), h>0. Show that, if X and Y are independent random variables, then Qx+y (h) min{Qx(h). Qr (h)).arrow_forward10. Prove that, if (t)=1+0(12) as asf->> O is a characteristic function, then p = 1.arrow_forward9. The concentration function of a random variable X is defined as Qx(h) sup P(x ≤x≤x+h), h>0. (b) Is it true that Qx(ah) =aQx (h)?arrow_forward
- 3. Let X1, X2,..., X, be independent, Exp(1)-distributed random variables, and set V₁₁ = max Xk and W₁ = X₁+x+x+ Isk≤narrow_forward7. Consider the function (t)=(1+|t|)e, ER. (a) Prove that is a characteristic function. (b) Prove that the corresponding distribution is absolutely continuous. (c) Prove, departing from itself, that the distribution has finite mean and variance. (d) Prove, without computation, that the mean equals 0. (e) Compute the density.arrow_forward1. Show, by using characteristic, or moment generating functions, that if fx(x) = ½ex, -∞0 < x < ∞, then XY₁ - Y2, where Y₁ and Y2 are independent, exponentially distributed random variables.arrow_forward
- 1. Show, by using characteristic, or moment generating functions, that if 1 fx(x): x) = ½exarrow_forward1990) 02-02 50% mesob berceus +7 What's the probability of getting more than 1 head on 10 flips of a fair coin?arrow_forward9. The concentration function of a random variable X is defined as Qx(h) sup P(x≤x≤x+h), h>0. = x (a) Show that Qx+b(h) = Qx(h).arrow_forward
- Suppose that you buy a lottery ticket, and you have to pick six numbers from 1 through 50 (repetitions allowed). Which combination is more likely to win: 13, 48, 17, 22, 6, 39 or 1, 2, 3, 4, 5, 6? barrow_forward2 Make a histogram from this data set of test scores: 72, 79, 81, 80, 63, 62, 89, 99, 50, 78, 87, 97, 55, 69, 97, 87, 88, 99, 76, 78, 65, 77, 88, 90, and 81. Would a pie chart be appropriate for this data? ganizing Quantitative Data: Charts and Graphs 45arrow_forward10 Meteorologists use computer models to predict when and where a hurricane will hit shore. Suppose they predict that hurricane Stat has a 20 percent chance of hitting the East Coast. a. On what info are the meteorologists basing this prediction? b. Why is this prediction harder to make than your chance of getting a head on your next coin toss? U anoiaarrow_forward
 Big Ideas Math A Bridge To Success Algebra 1: Stu...AlgebraISBN:9781680331141Author:HOUGHTON MIFFLIN HARCOURTPublisher:Houghton Mifflin Harcourt
 Glencoe Algebra 1, Student Edition, 9780079039897...AlgebraISBN:9780079039897Author:CarterPublisher:McGraw Hill
 Holt Mcdougal Larson Pre-algebra: Student Edition...AlgebraISBN:9780547587776Author:HOLT MCDOUGALPublisher:HOLT MCDOUGAL