
Elementary Statistics with Student Access Kit
12th Edition
ISBN: 9780321869470
Author: Mario F. Triola
Publisher: PEARSON
expand_more
expand_more
format_list_bulleted
Videos
Textbook Question
Chapter 12, Problem 3RE
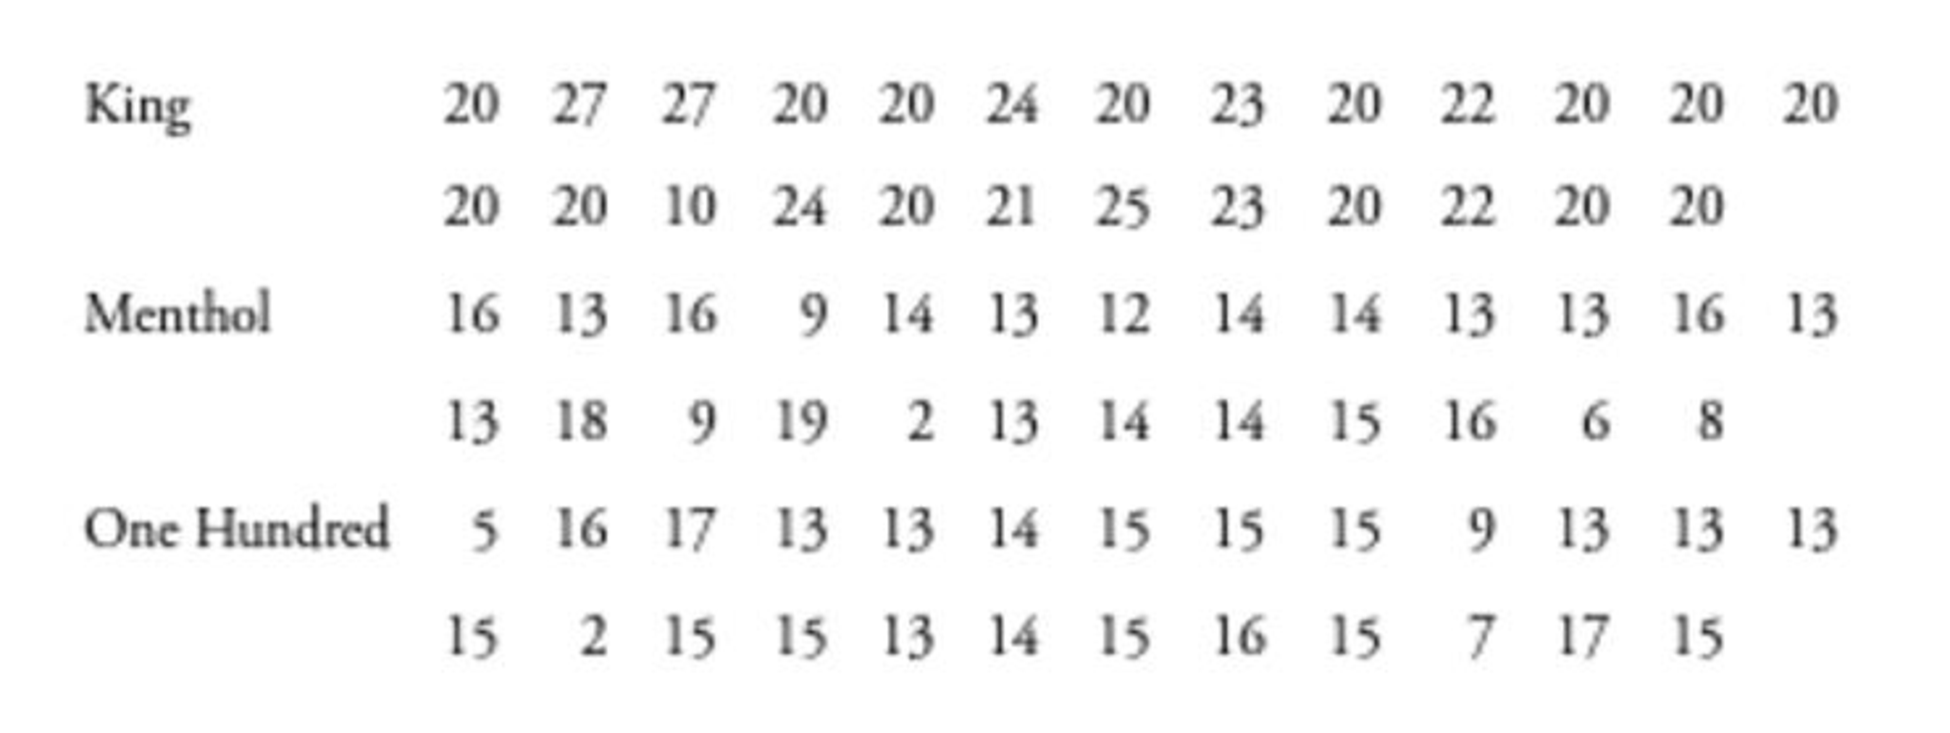
Tar in Cigarettes Data Set 10 in Appendix B includes the amounts of tar (mg per cigarette) in the king-size cigarettes, the 100-mm menthol cigarettes, and the 100-mm nonmenthol cigarettes. (The data are listed on the next page.) The king-size cigarettes are nonfiltered, nonmenthol, and nonlight. The 100-mm menthol cigarettes are filtered and nonlight. The 100-mm nonmenthol cigarettes arc filtered and nonlight. Use a 0.05 significance level to test the claim that the three categories of cigarettes yield the same
Expert Solution & Answer
Want to see the full answer?
Check out a sample textbook solution
Students have asked these similar questions
mean trough level of the population to be 3.7 micrograms/mL. The researcher conducts a study among 93 newly diagnosed arthritis patients and finds the mean trough to be 4.1 micrograms/mL with a standard deviation of 2.4 micrograms/mL. The researcher wants to test at the 5% level of significance if the trough is different than previously reported or not. Z statistics will be used.
Complete Step 5 of hypothesis testing: Conclusion. State whether or not you would reject the null hypothesis and why. Also interpret what this means (i.e. is the mean trough different from 3.7 or no
30% of all college students major in STEM (Science, Technology, Engineering, and Math). If 48 college students are randomly selected, find the probability thata. Exactly 12 of them major in STEM. b. At most 17 of them major in STEM. c. At least 12 of them major in STEM. d. Between 9 and 13 (including 9 and 13) of them major in STEM.
7% of all Americans live in poverty. If 40 Americans are randomly selected, find the probability thata. Exactly 4 of them live in poverty. b. At most 1 of them live in poverty. c. At least 1 of them live in poverty. d. Between 2 and 9 (including 2 and 9) of them live in poverty.
Chapter 12 Solutions
Elementary Statistics with Student Access Kit
Ch. 12.2 - In Exercises 1-4, use the following listed chest...Ch. 12.2 - Prob. 2BSCCh. 12.2 - In Exercises 1-4, use the following listed chest...Ch. 12.2 - Prob. 4BSCCh. 12.2 - In Exercises 516, use analysis of variance for the...Ch. 12.2 - In Exercises 516, use analysis of variance for the...Ch. 12.2 - Highway Fuel Consumption Data Set 14 in Appendix B...Ch. 12.2 - City Fuel Consumption Data Set 14 in Appendix B...Ch. 12.2 - Head Injury Crash Test Data Exercises 14 use chest...Ch. 12.2 - Pelvis Injury Crash Test Data Exercises 14 use...
Ch. 12.2 - Prob. 11BSCCh. 12.2 - Prob. 12BSCCh. 12.2 - Prob. 13BSCCh. 12.2 - Prob. 14BSCCh. 12.2 - Prob. 15BSCCh. 12.2 - Prob. 16BSCCh. 12.2 - Tukey Test A display of the Bonferroni test...Ch. 12.3 - Prob. 1BSCCh. 12.3 - Prob. 2BSCCh. 12.3 - Prob. 3BSCCh. 12.3 - Prob. 4BSCCh. 12.3 - Prob. 5BSCCh. 12.3 - Car Crash Tests The following table lists results...Ch. 12.3 - Prob. 7BSCCh. 12.3 - Prob. 8BSCCh. 12.3 - Self-Esteem The following table lists measures of...Ch. 12.3 - Prob. 10BSCCh. 12.3 - Prob. 11BBCh. 12 - Measures of Voltage The author measured voltage...Ch. 12 - Prob. 2CQQCh. 12 - Prob. 3CQQCh. 12 - Prob. 4CQQCh. 12 - Prob. 5CQQCh. 12 - Prob. 6CQQCh. 12 - Prob. 7CQQCh. 12 - Prob. 8CQQCh. 12 - Using the same results given in Exercise 8, does...Ch. 12 - Prob. 1RECh. 12 - Prob. 2RECh. 12 - Tar in Cigarettes Data Set 10 in Appendix B...Ch. 12 - Smoking, Body Temperature, Gender The table below...Ch. 12 - Prob. 1CRECh. 12 - Prob. 2CRECh. 12 - Prob. 3CRECh. 12 - Prob. 4CRECh. 12 - In Exercises 1-5, refer to the following list of...Ch. 12 - Freshman 15: Correlation/Regression listed below...Ch. 12 - Platelets: Normal Distribution Based on Data Set 1...Ch. 12 - Job Priority Survey USA Today reported about an...Ch. 12 - Prob. 9CRECh. 12 - Lottery: Goodness-of-Fit The bars in the histogram...Ch. 12 - Prob. 10CQQCh. 12 - Chocolate Chips Revisited The Chapter Problem for...
Knowledge Booster


Learn more about
Need a deep-dive on the concept behind this application? Look no further. Learn more about this topic, statistics and related others by exploring similar questions and additional content below.Similar questions
- 48% of all violent felons in the prison system are repeat offenders. If 40 violent felons are randomly selected, find the probability that a. Exactly 18 of them are repeat offenders. b. At most 18 of them are repeat offenders. c. At least 18 of them are repeat offenders. d. Between 17 and 21 (including 17 and 21) of them are repeat offenders.arrow_forwardConsider an MA(6) model with θ1 = 0.5, θ2 = −25, θ3 = 0.125, θ4 = −0.0625, θ5 = 0.03125, and θ6 = −0.015625. Find a much simpler model that has nearly the same ψ-weights.arrow_forwardLet {Yt} be an AR(2) process of the special form Yt = φ2Yt − 2 + et. Use first principles to find the range of values of φ2 for which the process is stationary.arrow_forward
- Describe the important characteristics of the autocorrelation function for the following models: (a) MA(1), (b) MA(2), (c) AR(1), (d) AR(2), and (e) ARMA(1,1).arrow_forward« CENGAGE MINDTAP Quiz: Chapter 38 Assignment: Quiz: Chapter 38 ips Questions ra1kw08h_ch38.15m 13. 14. 15. O Which sentence has modifiers in the correct place? O a. When called, she for a medical emergency responds quickly. b. Without giving away too much of the plot, Helena described the heroine's actions in the film. O c. Nearly the snakebite victim died before the proper antitoxin was injected. . O O 16 16. O 17. 18. O 19. O 20 20. 21 21. 22. 22 DS 23. 23 24. 25. O O Oarrow_forwardQuestions ra1kw08h_ch36.14m 12. 13. 14. 15. 16. Ӧ 17. 18. 19. OS 20. Two separate sentences need Oa. two separate subjects. Ob. two dependent clauses. c. one shared subject.arrow_forward
- Customers experiencing technical difficulty with their Internet cable service may call an 800 number for technical support. It takes the technician between 30 seconds and 11 minutes to resolve the problem. The distribution of this support time follows the uniform distribution. Required: a. What are the values for a and b in minutes? Note: Do not round your intermediate calculations. Round your answers to 1 decimal place. b-1. What is the mean time to resolve the problem? b-2. What is the standard deviation of the time? c. What percent of the problems take more than 5 minutes to resolve? d. Suppose we wish to find the middle 50% of the problem-solving times. What are the end points of these two times?arrow_forwardExercise 6-6 (Algo) (LO6-3) The director of admissions at Kinzua University in Nova Scotia estimated the distribution of student admissions for the fall semester on the basis of past experience. Admissions Probability 1,100 0.5 1,400 0.4 1,300 0.1 Click here for the Excel Data File Required: What is the expected number of admissions for the fall semester? Compute the variance and the standard deviation of the number of admissions. Note: Round your standard deviation to 2 decimal places.arrow_forward1. Find the mean of the x-values (x-bar) and the mean of the y-values (y-bar) and write/label each here: 2. Label the second row in the table using proper notation; then, complete the table. In the fifth and sixth columns, show the 'products' of what you're multiplying, as well as the answers. X y x minus x-bar y minus y-bar (x minus x-bar)(y minus y-bar) (x minus x-bar)^2 xy 16 20 34 4-2 5 2 3. Write the sums that represents Sxx and Sxy in the table, at the bottom of their respective columns. 4. Find the slope of the Regression line: bi = (simplify your answer) 5. Find the y-intercept of the Regression line, and then write the equation of the Regression line. Show your work. Then, BOX your final answer. Express your line as "y-hat equals...arrow_forward
- Apply STATA commands & submit the output for each question only when indicated below i. Generate the log of birthweight and family income of children. Name these new variables Ibwght & Ifaminc. Include the output of this code. ii. Apply the command sum with the detail option to the variable faminc. Note: you should find the 25th percentile value, the 50th percentile and the 75th percentile value of faminc from the output - you will need it to answer the next question Include the output of this code. iii. iv. Use the output from part ii of this question to Generate a variable called "high_faminc" that takes a value 1 if faminc is less than or equal to the 25th percentile, it takes the value 2 if faminc is greater than 25th percentile but less than or equal to the 50th percentile, it takes the value 3 if faminc is greater than 50th percentile but less than or equal to the 75th percentile, it takes the value 4 if faminc is greater than the 75th percentile. Include the outcome of this code…arrow_forwardsolve this on paperarrow_forwardApply STATA commands & submit the output for each question only when indicated below i. Apply the command egen to create a variable called "wyd" which is the rowtotal function on variables bwght & faminc. ii. Apply the list command for the first 10 observations to show that the code in part i worked. Include the outcome of this code iii. Apply the egen command to create a new variable called "bwghtsum" using the sum function on variable bwght by the variable high_faminc (Note: need to apply the bysort' statement) iv. Apply the "by high_faminc" statement to find the V. descriptive statistics of bwght and bwghtsum Include the output of this code. Why is there a difference between the standard deviations of bwght and bwghtsum from part iv of this question?arrow_forward
arrow_back_ios
SEE MORE QUESTIONS
arrow_forward_ios
Recommended textbooks for you
 Glencoe Algebra 1, Student Edition, 9780079039897...AlgebraISBN:9780079039897Author:CarterPublisher:McGraw Hill
 Mathematics For Machine TechnologyAdvanced MathISBN:9781337798310Author:Peterson, John.Publisher:Cengage Learning,
 Elementary Geometry For College Students, 7eGeometryISBN:9781337614085Author:Alexander, Daniel C.; Koeberlein, Geralyn M.Publisher:Cengage,
 Algebra: Structure And Method, Book 1AlgebraISBN:9780395977224Author:Richard G. Brown, Mary P. Dolciani, Robert H. Sorgenfrey, William L. ColePublisher:McDougal Littell
Glencoe Algebra 1, Student Edition, 9780079039897...
Algebra
ISBN:9780079039897
Author:Carter
Publisher:McGraw Hill
Mathematics For Machine Technology
Advanced Math
ISBN:9781337798310
Author:Peterson, John.
Publisher:Cengage Learning,
Elementary Geometry For College Students, 7e
Geometry
ISBN:9781337614085
Author:Alexander, Daniel C.; Koeberlein, Geralyn M.
Publisher:Cengage,
Algebra: Structure And Method, Book 1
Algebra
ISBN:9780395977224
Author:Richard G. Brown, Mary P. Dolciani, Robert H. Sorgenfrey, William L. Cole
Publisher:McDougal Littell
Hypothesis Testing using Confidence Interval Approach; Author: BUM2413 Applied Statistics UMP;https://www.youtube.com/watch?v=Hq1l3e9pLyY;License: Standard YouTube License, CC-BY
Hypothesis Testing - Difference of Two Means - Student's -Distribution & Normal Distribution; Author: The Organic Chemistry Tutor;https://www.youtube.com/watch?v=UcZwyzwWU7o;License: Standard Youtube License