
Concept explainers
Videos
To test: The hypothesis that the mean IQs of the various educational levels of the subjects are equal or not.
Answer to Problem 2DA
There is significant difference between the means
Explanation of Solution
Given info:
The databank shows the IQs of the various educational levels of the subjects.
Calculation:
Answers may vary. One of the possible answers is as follows:
Select random samples from the databank. The samples are given below.
| No high school degree | High school degree | College graduate | Graduate degree |
| 103 | 106 | 110 | 121 |
| 101 | 98 | 106 | 129 |
| 103 | 99 | 116 | 126 |
| 100 | 122 | 100 | 128 |
| 116 | 109 | 113 | 131 |
| 103 | 100 | 114 |
The hypotheses are given below:
Null hypothesis:
Alternative hypothesis:
Here, the difference in the mean percentage of voters in different places is tested. Hence, the claim is that,there is a difference in the mean percentage of voters in different places.
The number of samples k is 4, the sample sizes
The degrees of freedom are
Where
Substitute 4 for k in
Substitute 23 for N and 4 for k in
Critical value:
The critical F-value is obtained using the Table H: The F-Distribution with the level of significance
Procedure:
- Locate 19 in the degrees of freedom, denominator row of the Table H.
- Obtain the value in the corresponding degrees of freedom, numerator column below 3.
That is, the critical value is 3.13.
Rejection region:
The null hypothesis would be rejected if
Software procedure:
Step-by-step procedure to obtain the test statistic using the MINITAB software:
- Choose Stat > ANOVA > One-Way.
- In Response, enter the IQ.
- In Factor, enter the Factor.
- Click OK.
Output using the MINITAB software is given below:
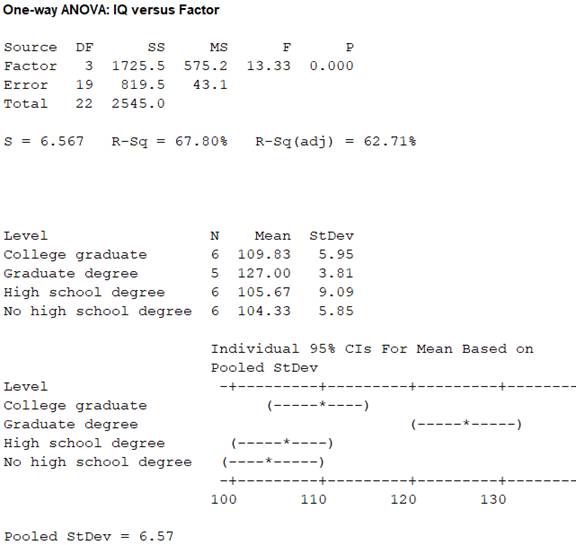
From the MINITAB output, the test valueF is 13.33.
Conclusion:
From the results, the test value is 13.33.
Here, the F-statistic value is greater than the critical value.
That is,
Thus, it can be concluding that, the null hypothesis is rejected.
Hence, there is evidence to reject the claim thatthe mean IQs of the various educational levels of the subjectsare equal. So use Scheffe test for where the difference exists.
Consider,
From the Minitab output, the sample sizes
The means are
The sample variances are
Critical value:
The formula for critical value F1 for the Scheffe test is,
Here, the critical value of F test is 3.13.
Substitute 3.13 for critical value is of F and 3 for k-1 in
Comparison of the means:
The formula for finding
That is,
Comparison between the means
The hypotheses are given below:
Null hypothesis:
Alternative hypothesis:
Rejection region:
The null hypothesis would be rejected if absolute value greater than the critical value.
The formula for comparing the means
Substitute 104.33 and 105.67 for
Thus, the value of
Conclusion:
The value of
Here, the value of
That is,
Thus, the null hypothesis is not rejected.
Hence, there is no significant difference between the means
Comparison between the means
The hypotheses are given below:
Null hypothesis:
Alternative hypothesis:
Rejection region:
The null hypothesis would be rejected if absolute value greater than the critical value.
The formula for comparing the means
Substitute 104.33 and 109.83 for
Thus, the value of
Conclusion:
The value of
Here, the value of
That is,
Thus, the null hypothesis is not rejected.
Hence, there is no significant difference between the means
Comparison between the means
The hypotheses are given below:
Null hypothesis:
Alternative hypothesis:
Rejection region:
The null hypothesis would be rejected if absolute value greater than the critical value.
The formula for comparing the means
Substitute 105.67 and 109.83 for
Thus, the value of
Conclusion:
The value of
Here, the value of
That is,
Thus, the null hypothesis is not rejected.
Hence, there is no significant difference between the means
Comparison between the means
The hypotheses are given below:
Null hypothesis:
Alternative hypothesis:
Rejection region:
The null hypothesis would be rejected if absolute value greater than the critical value.
The formula for comparing the means
Substitute 104.33 and 127.00 for
Thus, the value of
Conclusion:
The value of
Here, the value of
That is,
Thus, the null hypothesis is rejected.
Hence, there is significant difference between the means
Comparison between the means
The hypotheses are given below:
Null hypothesis:
Alternative hypothesis:
Rejection region:
The null hypothesis would be rejected if absolute value greater than the critical value.
The formula for comparing the means
Substitute 105.67 and 127.00 for
Thus, the value of
Conclusion:
The value of
Here, the value of
That is,
Thus, the null hypothesis is rejected.
Hence, there is significant difference between the means
Comparison between the means
The hypotheses are given below:
Null hypothesis:
Alternative hypothesis:
Rejection region:
The null hypothesis would be rejected if absolute value greater than the critical value.
The formula for comparing the means
Substitute 109.83 and 127.00 for
Thus, the value of
Conclusion:
The value of
Here, the value of
That is,
Thus, the null hypothesis is rejected.
Hence, there is significant difference between the means
Justification:
Here, there is significant difference between the means
Want to see more full solutions like this?
Chapter 12 Solutions
ELEMENTARY STATISTICS CONNECT CODE>CUS


- A marketing agency wants to determine whether different advertising platforms generate significantly different levels of customer engagement. The agency measures the average number of daily clicks on ads for three platforms: Social Media, Search Engines, and Email Campaigns. The agency collects data on daily clicks for each platform over a 10-day period and wants to test whether there is a statistically significant difference in the mean number of daily clicks among these platforms. Conduct ANOVA test. You can provide your answer by inserting a text box and the answer must include: also please provide a step by on getting the answers in excel Null hypothesis, Alternative hypothesis, Show answer (output table/summary table), and Conclusion based on the P value.arrow_forwardA company found that the daily sales revenue of its flagship product follows a normal distribution with a mean of $4500 and a standard deviation of $450. The company defines a "high-sales day" that is, any day with sales exceeding $4800. please provide a step by step on how to get the answers Q: What percentage of days can the company expect to have "high-sales days" or sales greater than $4800? Q: What is the sales revenue threshold for the bottom 10% of days? (please note that 10% refers to the probability/area under bell curve towards the lower tail of bell curve) Provide answers in the yellow cellsarrow_forwardBusiness Discussarrow_forward
- The following data represent total ventilation measured in liters of air per minute per square meter of body area for two independent (and randomly chosen) samples. Analyze these data using the appropriate non-parametric hypothesis testarrow_forwardeach column represents before & after measurements on the same individual. Analyze with the appropriate non-parametric hypothesis test for a paired design.arrow_forwardShould you be confident in applying your regression equation to estimate the heart rate of a python at 35°C? Why or why not?arrow_forward
 Glencoe Algebra 1, Student Edition, 9780079039897...AlgebraISBN:9780079039897Author:CarterPublisher:McGraw Hill
 Holt Mcdougal Larson Pre-algebra: Student Edition...AlgebraISBN:9780547587776Author:HOLT MCDOUGALPublisher:HOLT MCDOUGAL
 Big Ideas Math A Bridge To Success Algebra 1: Stu...AlgebraISBN:9781680331141Author:HOUGHTON MIFFLIN HARCOURTPublisher:Houghton Mifflin Harcourt