
Concept explainers
Videos
To create the following data we started with the same sample means and variances that appeared in problem 21 but doubled the
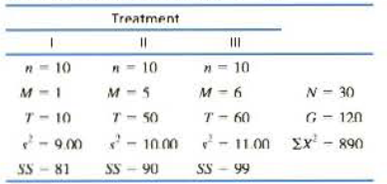
a. Predict how the increase in sample size should affect the F-ratio for these data compares to the values obtained in problem 21. Use an ANOVA with a – .05 to check your prediction. Note: Recause the sample are all the same size, MSwithin is the average of the three sample variances.
b. Predict how the increase in sample size should affect the value of η’ for these data compared to the η’ in problem 21. Calculate η’ to check your prediction.
a.
To predict: The effect on size of the F-ratio after increase in sample size.
To determine: There are any significant mean differences between treatments.
Answer to Problem 22P
On increasing the sample size, the size of F-ratio increases. There are significant mean differences between the treatments.
Explanation of Solution
Given info:
| Treatment | |||
| I | II | III | |
|
|
|
|
|
|
|
|
|
|
|
|
|
|
|
|
|
|
|
|
|
|
|
|
|
Level of significance is
Calculation:
On increasing the sample size, the sum of squares between treatments increases, hence numerator of the F-ratio increases. Therefore, size of F-ratio increases and chances to reject the null hypothesis increases.
Let k represents the numbers of treatments. Then,
Then, degrees of freedom corresponding to
Then, degrees of freedom corresponding to
Sum of squares between treatments is given as:
F-ratio is calculated as:
From the table
Since, F-ratio is greater than the critical value; therefore, the null hypothesis is rejected and conclude that there are significant mean differences between the treatments.
Conclusion:
On increasing the sample size, the size of F-ratio increases. There are significant mean differences between the treatments.
b.
To predict: The effect of increase in sample size on the effect size
To determine: The effect size
Answer to Problem 22P
On increasing the sample size: the effect size
Explanation of Solution
Calculation:
The formula for
On increasing the sample size, the sum of squares between treatments increases more rapidly than total sum of squares, so numerator becomes larger. Hence, the effect size
Sum of squares between treatments is given as:
Total sum of squares is calculated as:
The effect size for the study is given as:
Conclusion:
On increasing the sample size: the effect size
Want to see more full solutions like this?
Chapter 12 Solutions
Essentials Of Statistics For The Behavioral Sciences


- A special interest group reports a tiny margin of error (plus or minus 0.04 percent) for its online survey based on 50,000 responses. Is the margin of error legitimate? (Assume that the group’s math is correct.)arrow_forwardSuppose that 73 percent of a sample of 1,000 U.S. college students drive a used car as opposed to a new car or no car at all. Find an 80 percent confidence interval for the percentage of all U.S. college students who drive a used car.What sample size would cut this margin of error in half?arrow_forwardYou want to compare the average number of tines on the antlers of male deer in two nearby metro parks. A sample of 30 deer from the first park shows an average of 5 tines with a population standard deviation of 3. A sample of 35 deer from the second park shows an average of 6 tines with a population standard deviation of 3.2. Find a 95 percent confidence interval for the difference in average number of tines for all male deer in the two metro parks (second park minus first park).Do the parks’ deer populations differ in average size of deer antlers?arrow_forward
- Suppose that you want to increase the confidence level of a particular confidence interval from 80 percent to 95 percent without changing the width of the confidence interval. Can you do it?arrow_forwardA random sample of 1,117 U.S. college students finds that 729 go home at least once each term. Find a 98 percent confidence interval for the proportion of all U.S. college students who go home at least once each term.arrow_forwardSuppose that you make two confidence intervals with the same data set — one with a 95 percent confidence level and the other with a 99.7 percent confidence level. Which interval is wider?Is a wide confidence interval a good thing?arrow_forward
- Is it true that a 95 percent confidence interval means you’re 95 percent confident that the sample statistic is in the interval?arrow_forwardTines can range from 2 to upwards of 50 or more on a male deer. You want to estimate the average number of tines on the antlers of male deer in a nearby metro park. A sample of 30 deer has an average of 5 tines, with a population standard deviation of 3. Find a 95 percent confidence interval for the average number of tines for all male deer in this metro park.Find a 98 percent confidence interval for the average number of tines for all male deer in this metro park.arrow_forwardBased on a sample of 100 participants, the average weight loss the first month under a new (competing) weight-loss plan is 11.4 pounds with a population standard deviation of 5.1 pounds. The average weight loss for the first month for 100 people on the old (standard) weight-loss plan is 12.8 pounds, with population standard deviation of 4.8 pounds. Find a 90 percent confidence interval for the difference in weight loss for the two plans( old minus new) Whats the margin of error for your calculated confidence interval?arrow_forward
- A 95 percent confidence interval for the average miles per gallon for all cars of a certain type is 32.1, plus or minus 1.8. The interval is based on a sample of 40 randomly selected cars. What units represent the margin of error?Suppose that you want to decrease the margin of error, but you want to keep 95 percent confidence. What should you do?arrow_forward3. (i) Below is the R code for performing a X2 test on a 2×3 matrix of categorical variables called TestMatrix: chisq.test(Test Matrix) (a) Assuming we have a significant result for this procedure, provide the R code (including any required packages) for an appropriate post hoc test. (b) If we were to apply this technique to a 2 × 2 case, how would we adapt the code in order to perform the correct test? (ii) What procedure can we use if we want to test for association when we have ordinal variables? What code do we use in R to do this? What package does this command belong to? (iii) The following code contains the initial steps for a scenario where we are looking to investigate the relationship between age and whether someone owns a car by using frequencies. There are two issues with the code - please state these. Row3<-c(75,15) Row4<-c(50,-10) MortgageMatrix<-matrix(c(Row1, Row4), byrow=T, nrow=2, MortgageMatrix dimnames=list(c("Yes", "No"), c("40 or older","<40")))…arrow_forwardDescribe the situation in which Fisher’s exact test would be used?(ii) When do we use Yates’ continuity correction (with respect to contingencytables)?[2 Marks] 2. Investigate, checking the relevant assumptions, whether there is an associationbetween age group and home ownership based on the sample dataset for atown below:Home Owner: Yes NoUnder 40 39 12140 and over 181 59Calculate and evaluate the effect size.arrow_forward
 Glencoe Algebra 1, Student Edition, 9780079039897...AlgebraISBN:9780079039897Author:CarterPublisher:McGraw Hill