
Videos
For the preceding problem you should find that there are significant differences among the three treatments. One reason for the significance is that the sample variances are relatively small. To create the following data, we kept the same sample
- a. Calculate the sample variance for each of the three samples. Describe how these sample variances compare with those from problem 19.
- b. Predict how the increase in sample variance should influence the outcome of the analysis. That is, how will the F-ratio for these data compare with the value obtained m problem 19?
- c. Use an A VOVA with α – .05 to determine whether there are any significant differences among the three treatment means. (Does your answer agree with your prediction in purl b?)
a.
To compare: Obtained sample variances with sample variances from problem 19.
Answer to Problem 20P
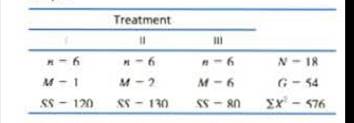
Sample variances for treatment 1, treatment 2, and treatment 3 are 24, 26 and 16 respectively. Obtained sample variance for each treatment are twice of the sample variance in problem 19.
Explanation of Solution
Given info:
The following values are from an independent-measures study comparing three treatment conditions.
| Treatment | |||
| I | II | III | |
|
|
|
|
|
|
|
|
|
|
|
|
|
|
|
Calculation:
Let k represents the numbers of treatments. Then,
For treatment 1
Let
For treatment 2
Let
For treatment 3
Let
The sample variances for treatment I, treatment II and treatment III in problem 19 are 12, 13 and 8 respectively. But sample variances for all treatments in this problem are twice of sample variances in problem 19.
Conclusion:
Sample variances for treatment 1, treatment 2, and treatment 3 are 24, 26 and 16 respectively. Obtained sample variance for each treatment are twice of the sample variance in problem 19.
b.
To predict: The outcome of the analysis.
Answer to Problem 20P
The size of the F-ratio decreases and there are fewer chances to reject the null hypothesis.
Explanation of Solution
From part a. sample variance for each treatment are twice of the sample variances in problem 19.
The formula for F ratio is:
F-ratio is inversely proportional to the mean sum of squares within treatments. So, large sample variances give large mean sum of squares within treatments and hence small value of F-ratio. Therefore, on increasing the size of sample variances, the size of F-ratio would decreases. So, when sample variances increases, chances to reject the null hypothesis decreases.
Conclusion:
The size of the F-ratio decreases and there are fewer chances to reject the null hypothesis.
c.
Answer to Problem 20P
There are no significant mean differences between the three treatments.
Explanation of Solution
Calculation:
Let k represents the numbers of treatments. Then,
Then, degrees of freedom corresponding to
Then, degrees of freedom corresponding to
Total sum of squares is given as:
Sum of squares between treatments is given as:
F-ratio is calculated as:
From the table
Since, F-ratio is less than the critical value; therefore, we fail to reject the null hypothesis and conclude that there are no significant mean differences between the treatments.
Conclusion:
There are no significant mean differences between the treatments. Also, the answer agree with prediction in part b.
Want to see more full solutions like this?
Chapter 12 Solutions
EBK APLIA FOR GRAVETTER/WALLNAU/FORZANO


- 38. Possible values of X, the number of components in a system submitted for repair that must be replaced, are 1, 2, 3, and 4 with corresponding probabilities .15, .35, .35, and .15, respectively. a. Calculate E(X) and then E(5 - X).b. Would the repair facility be better off charging a flat fee of $75 or else the amount $[150/(5 - X)]? [Note: It is not generally true that E(c/Y) = c/E(Y).]arrow_forward74. The proportions of blood phenotypes in the U.S. popula- tion are as follows:A B AB O .40 .11 .04 .45 Assuming that the phenotypes of two randomly selected individuals are independent of one another, what is the probability that both phenotypes are O? What is the probability that the phenotypes of two randomly selected individuals match?arrow_forward53. A certain shop repairs both audio and video compo- nents. Let A denote the event that the next component brought in for repair is an audio component, and let B be the event that the next component is a compact disc player (so the event B is contained in A). Suppose that P(A) = .6 and P(B) = .05. What is P(BA)?arrow_forward
- 26. A certain system can experience three different types of defects. Let A;(i = 1,2,3) denote the event that the sys- tem has a defect of type i. Suppose thatP(A1) = .12 P(A) = .07 P(A) = .05P(A, U A2) = .13P(A, U A3) = .14P(A2 U A3) = .10P(A, A2 A3) = .011Rshelfa. What is the probability that the system does not havea type 1 defect?b. What is the probability that the system has both type 1 and type 2 defects?c. What is the probability that the system has both type 1 and type 2 defects but not a type 3 defect? d. What is the probability that the system has at most two of these defects?arrow_forwardThe following are suggested designs for group sequential studies. Using PROCSEQDESIGN, provide the following for the design O’Brien Fleming and Pocock.• The critical boundary values for each analysis of the data• The expected sample sizes at each interim analysisAssume the standardized Z score method for calculating boundaries.Investigators are evaluating the success rate of a novel drug for treating a certain type ofbacterial wound infection. Since no existing treatment exists, they have planned a one-armstudy. They wish to test whether the success rate of the drug is better than 50%, whichthey have defined as the null success rate. Preliminary testing has estimated the successrate of the drug at 55%. The investigators are eager to get the drug into production andwould like to plan for 9 interim analyses (10 analyzes in total) of the data. Assume thesignificance level is 5% and power is 90%.Besides, draw a combined boundary plot (OBF, POC, and HP)arrow_forwardPlease provide the solution for the attached image in detailed.arrow_forward
- 20 km, because GISS Worksheet 10 Jesse runs a small business selling and delivering mealie meal to the spaza shops. He charges a fixed rate of R80, 00 for delivery and then R15, 50 for each packet of mealle meal he delivers. The table below helps him to calculate what to charge his customers. 10 20 30 40 50 Packets of mealie meal (m) Total costs in Rands 80 235 390 545 700 855 (c) 10.1. Define the following terms: 10.1.1. Independent Variables 10.1.2. Dependent Variables 10.2. 10.3. 10.4. 10.5. Determine the independent and dependent variables. Are the variables in this scenario discrete or continuous values? Explain What shape do you expect the graph to be? Why? Draw a graph on the graph provided to represent the information in the table above. TOTAL COST OF PACKETS OF MEALIE MEAL 900 800 700 600 COST (R) 500 400 300 200 100 0 10 20 30 40 60 NUMBER OF PACKETS OF MEALIE MEALarrow_forwardLet X be a random variable with support SX = {−3, 0.5, 3, −2.5, 3.5}. Part ofits probability mass function (PMF) is given bypX(−3) = 0.15, pX(−2.5) = 0.3, pX(3) = 0.2, pX(3.5) = 0.15.(a) Find pX(0.5).(b) Find the cumulative distribution function (CDF), FX(x), of X.1(c) Sketch the graph of FX(x).arrow_forwardA well-known company predominantly makes flat pack furniture for students. Variability with the automated machinery means the wood components are cut with a standard deviation in length of 0.45 mm. After they are cut the components are measured. If their length is more than 1.2 mm from the required length, the components are rejected. a) Calculate the percentage of components that get rejected. b) In a manufacturing run of 1000 units, how many are expected to be rejected? c) The company wishes to install more accurate equipment in order to reduce the rejection rate by one-half, using the same ±1.2mm rejection criterion. Calculate the maximum acceptable standard deviation of the new process.arrow_forward
- 5. Let X and Y be independent random variables and let the superscripts denote symmetrization (recall Sect. 3.6). Show that (X + Y) X+ys.arrow_forward8. Suppose that the moments of the random variable X are constant, that is, suppose that EX" =c for all n ≥ 1, for some constant c. Find the distribution of X.arrow_forward9. The concentration function of a random variable X is defined as Qx(h) = sup P(x ≤ X ≤x+h), h>0. Show that, if X and Y are independent random variables, then Qx+y (h) min{Qx(h). Qr (h)).arrow_forward
 Glencoe Algebra 1, Student Edition, 9780079039897...AlgebraISBN:9780079039897Author:CarterPublisher:McGraw Hill
 Big Ideas Math A Bridge To Success Algebra 1: Stu...AlgebraISBN:9781680331141Author:HOUGHTON MIFFLIN HARCOURTPublisher:Houghton Mifflin Harcourt
 Functions and Change: A Modeling Approach to Coll...AlgebraISBN:9781337111348Author:Bruce Crauder, Benny Evans, Alan NoellPublisher:Cengage Learning
 Linear Algebra: A Modern IntroductionAlgebraISBN:9781285463247Author:David PoolePublisher:Cengage Learning