
Videos
For the preceding problem you should find that there are significant differences among the three treatments. One reason for the significance is that the sample variances are relatively small. To create the following data, we kept the same sample
- a. Calculate the sample variance for each of the three samples. Describe how these sample variances compare with those from problem 19.
- b. Predict how the increase in sample variance should influence the outcome of the analysis. That is, how will the F-ratio for these data compare with the value obtained m problem 19?
- c. Use an A VOVA with α – .05 to determine whether there are any significant differences among the three treatment means. (Does your answer agree with your prediction in purl b?)
a.
To compare: Obtained sample variances with sample variances from problem 19.
Answer to Problem 20P
Sample variances for treatment 1, treatment 2, and treatment 3 are 24, 26 and 16 respectively. Obtained sample variance for each treatment are twice of the sample variance in problem 19.
Explanation of Solution
Given info:
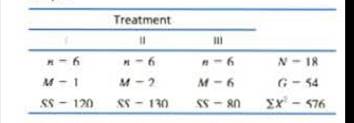
The following values are from an independent-measures study comparing three treatment conditions.
| Treatment | |||
| I | II | III | |
|
|
|
|
|
|
|
|
|
|
|
|
|
|
|
Calculation:
Let k represents the numbers of treatments. Then,
For treatment 1
Let
For treatment 2
Let
For treatment 3
Let
The sample variances for treatment I, treatment II and treatment III in problem 19 are 12, 13 and 8 respectively. But sample variances for all treatments in this problem are twice of sample variances in problem 19.
Conclusion:
Sample variances for treatment 1, treatment 2, and treatment 3 are 24, 26 and 16 respectively. Obtained sample variance for each treatment are twice of the sample variance in problem 19.
b.
To predict: The outcome of the analysis.
Answer to Problem 20P
The size of the F-ratio decreases and there are fewer chances to reject the null hypothesis.
Explanation of Solution
From part a. sample variance for each treatment are twice of the sample variances in problem 19.
The formula for F ratio is:
F-ratio is inversely proportional to the mean sum of squares within treatments. So, large sample variances give large mean sum of squares within treatments and hence small value of F-ratio. Therefore, on increasing the size of sample variances, the size of F-ratio would decreases. So, when sample variances increases, chances to reject the null hypothesis decreases.
Conclusion:
The size of the F-ratio decreases and there are fewer chances to reject the null hypothesis.
c.
Answer to Problem 20P
There are no significant mean differences between the three treatments.
Explanation of Solution
Calculation:
Let k represents the numbers of treatments. Then,
Then, degrees of freedom corresponding to
Then, degrees of freedom corresponding to
Total sum of squares is given as:
Sum of squares between treatments is given as:
F-ratio is calculated as:
From the table
Since, F-ratio is less than the critical value; therefore, we fail to reject the null hypothesis and conclude that there are no significant mean differences between the treatments.
Conclusion:
There are no significant mean differences between the treatments. Also, the answer agree with prediction in part b.
Want to see more full solutions like this?
Chapter 12 Solutions
Essentials of Statistics for The Behavioral Sciences (MindTap Course List)


- Negate the following compound statement using De Morgans's laws.arrow_forwardCharacterize (with proof) all connected graphs that contain no even cycles in terms oftheir blocks.arrow_forwardLet G be a connected graph that does not have P4 or C3 as an induced subgraph (i.e.,G is P4, C3 free). Prove that G is a complete bipartite grapharrow_forward
- Prove sufficiency of the condition for a graph to be bipartite that is, prove that if G hasno odd cycles then G is bipartite as follows:Assume that the statement is false and that G is an edge minimal counterexample. That is, Gsatisfies the conditions and is not bipartite but G − e is bipartite for any edge e. (Note thatthis is essentially induction, just using different terminology.) What does minimality say aboutconnectivity of G? Can G − e be disconnected? Explain why if there is an edge between twovertices in the same part of a bipartition of G − e then there is an odd cyclearrow_forwardLet G be a connected graph that does not have P4 or C4 as an induced subgraph (i.e.,G is P4, C4 free). Prove that G has a vertex adjacent to all othersarrow_forwardWe consider a one-period market with the following properties: the current stock priceis S0 = 4. At time T = 1 year, the stock has either moved up to S1 = 8 (with probability0.7) or down towards S1 = 2 (with probability 0.3). We consider a call option on thisstock with maturity T = 1 and strike price K = 5. The interest rate on the money marketis 25% yearly.(a) Find the replicating portfolio (φ, ψ) corresponding to this call option.(b) Find the risk-neutral (no-arbitrage) price of this call option.(c) We now consider a put option with maturity T = 1 and strike price K = 3 onthe same market. Find the risk-neutral price of this put option. Reminder: A putoption gives you the right to sell the stock for the strike price K.1(d) An investor with initial capital X0 = 0 wants to invest on this market. He buysα shares of the stock (or sells them if α is negative) and buys β call options (orsells them is β is negative). He invests the cash balance on the money market (orborrows if the amount is…arrow_forward
- Question 3: p and q represent the following simple statements. p: Calgary is the capital of Alberta. A) Determine the value of each simple statement p and q. B) Then, without truth table, determine the va q: Alberta is a province of Canada. for each following compound statement below. pvq р^~q ~рл~q ~q→ p ~P~q Pq b~ (d~ ← b~) d~ (b~ v d) 0 4arrow_forward2. Let X be a random variable. (a) Show that, if E X2 = 1 and E X4arrow_forward1. Show that, for any non-negative random variable X, EX+E+≥2, X E max X. 21.arrow_forwardarrow_back_iosSEE MORE QUESTIONSarrow_forward_ios
 Glencoe Algebra 1, Student Edition, 9780079039897...AlgebraISBN:9780079039897Author:CarterPublisher:McGraw Hill
 Big Ideas Math A Bridge To Success Algebra 1: Stu...AlgebraISBN:9781680331141Author:HOUGHTON MIFFLIN HARCOURTPublisher:Houghton Mifflin Harcourt
 Functions and Change: A Modeling Approach to Coll...AlgebraISBN:9781337111348Author:Bruce Crauder, Benny Evans, Alan NoellPublisher:Cengage Learning
 Linear Algebra: A Modern IntroductionAlgebraISBN:9781285463247Author:David PoolePublisher:Cengage Learning