(a):
Cumulative distribution of income.
(a):
Explanation of Solution
The economic development is achieved when the economic price increases per head of the population in the economy. The unequal distribution of the economic price between the people in the economy causes the income inequality in the economy. The income inequality is the situation in the economy in which the major part of the income will be earned by a smaller proportion of the population and vice versa.
The cumulative share of income can be easily calculated by adding the share of income with each preceding level's cumulative share of income. Here, in this case, the percentage share of income for A for the lowest fifth is 17.7 percent. Since there are no preceding levels, the cumulative share would remain the same as 17.7 percent. The percentage share of income for the second lowest fifth is 19.9 percent. Thus, the cumulative share of the second lowest fifth will be summation of the percentage share of both lowest fifth and second lowest fifth, which can be calculated as follows:
Thus, the cumulative share of income for the second lowest fifth is calculated to be 37.6 percent. Similarly, the cumulative share of income can be calculated, and the table can be completed as follows:
| A | B | |||
| Percentage of families | Percentage share | Cumulative share | Percentage share | Cumulative share |
| Lowest fifth | 17.7% | 17.7% | 9.0% | 9.0% |
| Second lowest fifth | 19.9 | 37.6 | 14.2 | 23.2 |
| Middle fifth | 20.4 | 58.0 | 17.5 | 40.7 |
| Second highest fifth | 20.7 | 78.7 | 21.9 | 62.6 |
| Highest fifth | 21.3 | 100.0 | 37.4 | 100.0 |
Income Inequality: The income inequality is the situation where most of the
(b):
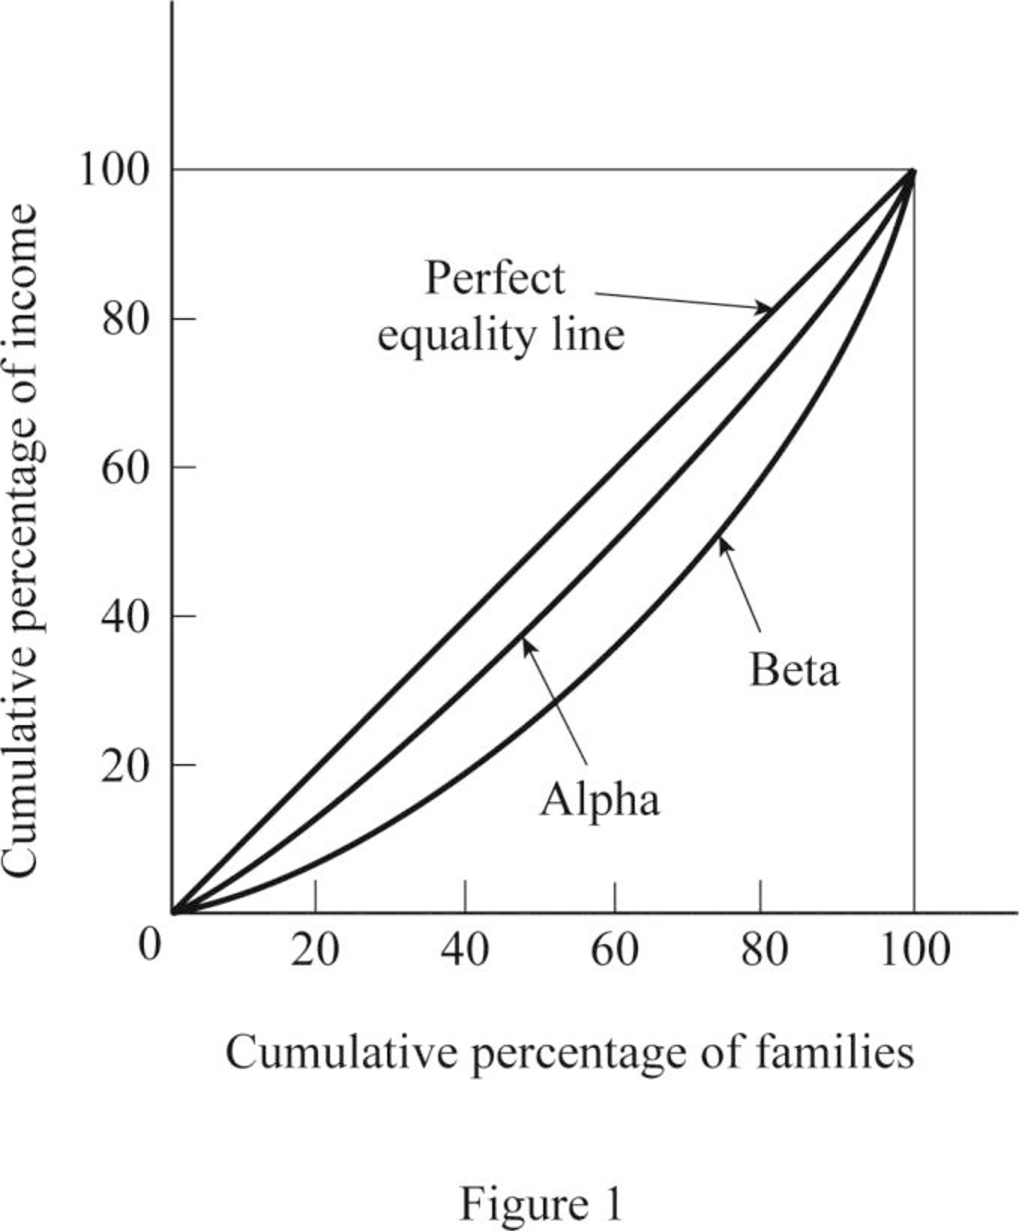
Lorenz curve of the economy.
(b):
Explanation of Solution
The Lorenz curve is the graphical illustration of the distribution of wealth in the economy. It is drawn on the cumulative percentage of income against the cumulative percentage of the population. Thus, it shows the cumulative shares of income received by the family. Thus, based on the table above, the Lorenz curve can be constructed as follows:
(c):
Country with more equal distribution of income.
(c):
Explanation of Solution
From the Lorenz curve diagram, it can be identified that the line that lies more close to the line of equality has more equal distribution of income. From the diagram, it is identified that Lorenz curve of Country A is closest to the line of equality and thus, Country A has more equal income distribution.
Want to see more full solutions like this?
Chapter 12 Solutions
Economics For Today

- Problem 2. If the consumer preference can be represented by a CES function with δ = 0.5, i.e. u(x, y) = x0.5 + y0.5. Let the prices and income be (px, py, w). 1. Set up the Lagrangian expression.2. Take the first-order conditions.3. Substitute into budget constraint to derive the optimal consumption bundles.arrow_forward1. A town relies on four different sources for its non-drinking water needs: dam water, reclaimed water, rain water, and desalinated water. The different sources carry different risks and costs. For instance, desalinated water is fully reliable due to abundant sea water, but it is more expensive than other options. Reclaimed water also has relatively lower risk than rain or dam water since a certain amount can be obtained, even during the dry. season, by the treatment of daily generated waste water. Using any of the four options requires an investment in that resource. The return on a particular water source is defined as the amount of water generated by the source per dollar of investment in it. The expected returns and standard deviations of those returns for the four water sources are described in the following table: Water resource Expected return St. Deviation Dam water 2.7481 0.2732 Reclaimed water 1.6005 0.0330 Rain water 0.5477 0.2865 Desalinated water 0.3277 0.0000 Higher…arrow_forward1. Imagine a society that produces military goods and consumer goods, which we'll call "guns" and "butter." a. Draw a production possibilities frontier for guns and butter. Using the concept of opportunity cost, explain why it most likely has a bowed-out shape. b. Show a point that is impossible for the economy to achieve. Show a point that is feasible but inefficient. c. Imagine that the society has two political parties, called the Hawks (who want a strong military) and the Doves (who want a smaller military). Show a point on your production possibilities frontier that the Hawks might choose and a point the Doves might choose. d. Imagine that an aggressive neighboring country reduces the size of its military. As a result, both the Hawks and the Doves reduce their desired production of guns by the same amount. Which party would get the bigger "peace dividend," measured by the increase in butter production? Explain.arrow_forward
- A health study tracked a group of persons for five years. At the beginning of the study, 20%were classified as heavy smokers, 30% as light smokers, and 50% as nonsmokers. Resultsof the study showed that light smokers were twice as likely as nonsmokers to die duringthe five-year study, but only half as likely as heavy smokers.A randomly selected participant from the study died during the five-year period. Calculatethe probability that the participant was a heavy smokerarrow_forwardConsider two assets with the following returns: State Prob. of state R₁ R2 1 23 13 25% 5% 2 -10% 1% Compute the optimal portfolio for an investor having a Bernoulli utility of net returns u(r) = 2√√r+ 10. Compute the certainty equivalent of the optimal portfolio. Do the results change if short-selling is not allowed? If so, how?arrow_forwardIn the graph at the right, the average variable cost is curve ☐. The average total cost is curve marginal cost is curve The C Cost per Unit ($) Per Unit Costs A 0 Output Quantity Barrow_forward
- What are some of the question s that I can ask my economic teacher?arrow_forwardAnswer question 2 only.arrow_forward1. A pension fund manager is considering three mutual funds. The first is a stock fund, the second is a long-term government and corporate fund, and the third is a (riskless) T-bill money market fund that yields a rate of 8%. The probability distributions of the risky funds have the following characteristics: Standard Deviation (%) Expected return (%) Stock fund (Rs) 20 30 Bond fund (RB) 12 15 The correlation between the fund returns is .10.arrow_forward
- Frederick Jones operates a sole proprietorship business in Trinidad and Tobago. His gross annual revenue in 2023 was $2,000,000. He wants to register for VAT, but he is unsure of what VAT entails, the requirements for registration and what he needs to do to ensure that he is fully compliant with VAT regulations. Make reference to the Vat Act of Trinidad and Tobago and explain to Mr. Jones what VAT entails, the requirements for registration and the requirements to be fully compliant with VAT regulations.arrow_forwardCan you show me the answers for parts a and b? Thanks.arrow_forwardWhat are the answers for parts a and b? Thanksarrow_forward


 Economics (MindTap Course List)EconomicsISBN:9781337617383Author:Roger A. ArnoldPublisher:Cengage Learning
 Principles of Economics 2eEconomicsISBN:9781947172364Author:Steven A. Greenlaw; David ShapiroPublisher:OpenStax
 Microeconomics: Private and Public Choice (MindTa...EconomicsISBN:9781305506893Author:James D. Gwartney, Richard L. Stroup, Russell S. Sobel, David A. MacphersonPublisher:Cengage Learning