Concept explainers
Videos
Read bar graphs, line graphs, and circle graphs.
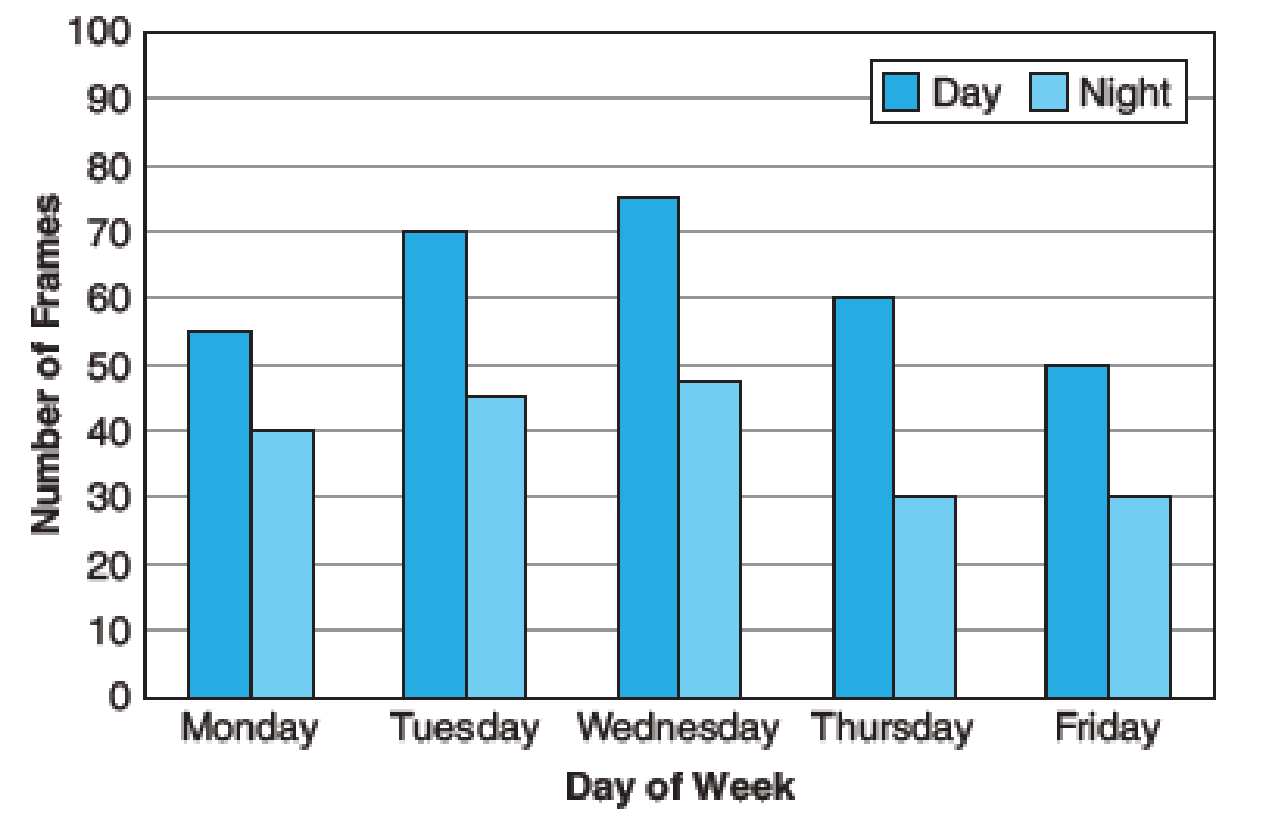
Trades Management From the bar graph below,
- (a) Determine the number of frames assembled by the Tuesday day shift. __________
- (b) Calculate the percent decrease in output from the Monday day shift to the Monday night shift. __________
Weekly Frame Assembly
Monthly Paint Jobs at Autobrite
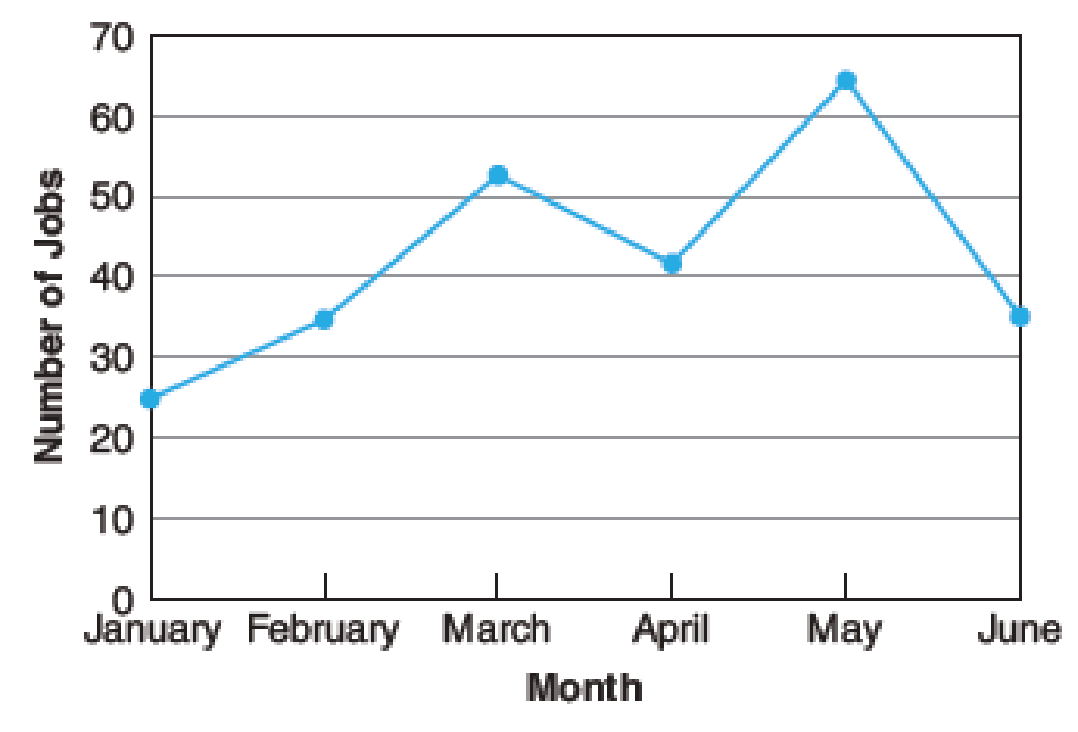
Problems (c) and (d) refer to the line graph above.
- (c) Determine the maximum number of paint jobs and the month during which they occurred. _________
- (d) Calculate the percent increase in the number of paint jobs from January to February. _________
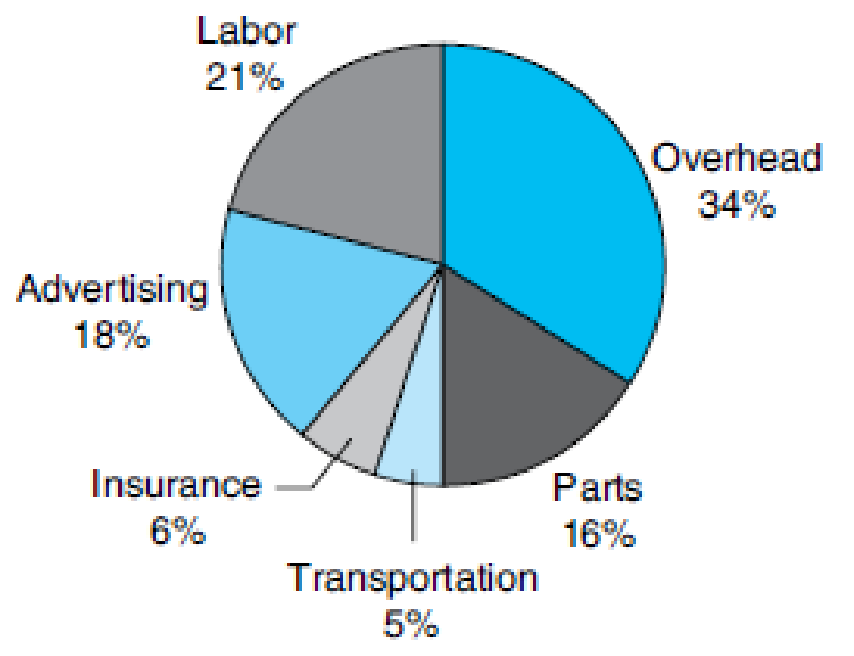
- (e) The average job for ABC Plumbing generates $227.50. Use the circle graph on the next page to calculate what portion of this amount is spent on advertising. _________
Percent of Business Expenditures
(a)
The number of frames assembled by the Tuesday day shift
Answer to Problem 1P
The number of frames assembled by the Tuesday day shift is
Explanation of Solution
Given:
The bar graph for the weekly frame assembly that is the number of frames in the day shift and night shift is mentioned.
Calculation:
From the bar graph, the height of the bar corresponding to the day of Tuesday for the day shift is 70. That is, there are 70 frames in the day shift.
Thus, the number of frames assembled by the Tuesday day shift is
(b)
The percent decrease in output from the Monday day shift to the Monday night shift
Answer to Problem 1P
The percent decrease in output from the Monday day shift to the Monday night shift is
Explanation of Solution
Formula used:
Percent change in proportion:
Calculation:
From the bar graph, the height of the bar corresponding to the day of Monday for the day shift is 55. That is, there are 55 frames in the day shift. The day of Monday for the night shift is 40. That is, there are 40 frames in the day shift.
The difference in frames is,
Substitute 55 as base and 15 as amount of decrease in the percent formula.
Thus, the percent decrease in output from the Monday day shift to the Monday night shift is
(c)
The maximum number of paint jobs and the month during which they occurred
Answer to Problem 1P
The maximum number of paint jobs is
The month during which maximum number of paint jobs occurred is
Explanation of Solution
Given:
The line graph of Monthly Paint Jobs at Autobrite is mentioned.
Calculation:
From the line graph it can be observed that the highest point of the paint jobs is 65 which correspond to the month of May. That is, the month of May has the highest jobs of 65.
Thus, the maximum number of paint jobs is
(d)
The percent increase in the number of paint jobs from January to February
Answer to Problem 1P
The percent increase in the number of paint jobs from January to February is
Explanation of Solution
From the line graph, the number of jobs corresponding to the month of January is 25 and the number of jobs corresponding to the month of February is 35.
The difference in jobs is,
Substitute 25 as base and 10 as amount of increase in the percent formula.
Thus, the percent increase in the number of paint jobs from January to February is
(e)
The portion of amount $227.50 that is spent on advertising based on the circle graph
Answer to Problem 1P
The portion of amount $227.50 that is spent on advertising based on the circle graph is
Explanation of Solution
Given:
The circle graph of Percent of Business Expenditures is mentioned. Also, average job for ABC Plumbing generates $227.50.
Calculation:
From the circle graph, the percentage of the business expenditure spent on advertising is 18%.
The amount is,
Thus, the portion of amount $227.50 that is spent on advertising based on the circle graph is
Want to see more full solutions like this?
Chapter 12 Solutions
Mathematics for the Trades: A Guided Approach, Books a la Carte edition (11th Edition)


- let h0, h1, h2,..., hn,....be the sequence defined by hn = (n C 2), (n choose 2). (n>=0). Determine the generating function for the sequence.arrow_forwardDraw the triangle and show all the workarrow_forwardThe average miles per gallon for a sample of 40 cars of model SX last year was 32.1, with a population standard deviation of 3.8. A sample of 40 cars from this year’s model SX has an average of 35.2 mpg, with a population standard deviation of 5.4. Find a 99 percent confidence interval for the difference in average mpg for this car brand (this year’s model minus last year’s).Find a 99 percent confidence interval for the difference in average mpg for last year’s model minus this year’s. What does the negative difference mean?arrow_forward
- A special interest group reports a tiny margin of error (plus or minus 0.04 percent) for its online survey based on 50,000 responses. Is the margin of error legitimate? (Assume that the group’s math is correct.)arrow_forwardSuppose that 73 percent of a sample of 1,000 U.S. college students drive a used car as opposed to a new car or no car at all. Find an 80 percent confidence interval for the percentage of all U.S. college students who drive a used car.What sample size would cut this margin of error in half?arrow_forwardYou want to compare the average number of tines on the antlers of male deer in two nearby metro parks. A sample of 30 deer from the first park shows an average of 5 tines with a population standard deviation of 3. A sample of 35 deer from the second park shows an average of 6 tines with a population standard deviation of 3.2. Find a 95 percent confidence interval for the difference in average number of tines for all male deer in the two metro parks (second park minus first park).Do the parks’ deer populations differ in average size of deer antlers?arrow_forward
- Suppose that you want to increase the confidence level of a particular confidence interval from 80 percent to 95 percent without changing the width of the confidence interval. Can you do it?arrow_forwardA random sample of 1,117 U.S. college students finds that 729 go home at least once each term. Find a 98 percent confidence interval for the proportion of all U.S. college students who go home at least once each term.arrow_forwardSuppose that you make two confidence intervals with the same data set — one with a 95 percent confidence level and the other with a 99.7 percent confidence level. Which interval is wider?Is a wide confidence interval a good thing?arrow_forward
 Algebra & Trigonometry with Analytic GeometryAlgebraISBN:9781133382119Author:SwokowskiPublisher:Cengage
 Glencoe Algebra 1, Student Edition, 9780079039897...AlgebraISBN:9780079039897Author:CarterPublisher:McGraw Hill
 Functions and Change: A Modeling Approach to Coll...AlgebraISBN:9781337111348Author:Bruce Crauder, Benny Evans, Alan NoellPublisher:Cengage Learning
 Holt Mcdougal Larson Pre-algebra: Student Edition...AlgebraISBN:9780547587776Author:HOLT MCDOUGALPublisher:HOLT MCDOUGAL
 Trigonometry (MindTap Course List)TrigonometryISBN:9781337278461Author:Ron LarsonPublisher:Cengage Learning