Materials: A computer with Internet access and a calculator
Estimated time: 15–20 minutes
Group Size: 3
Go to a website such as http://www.census.gov/ and determine the population of your state for the year 2000, and then for another year after that time. For example, the population of Florida in the year 2000 was approximately 16,050,000. Florida’s population in 2006 was approximately 18,090,000.
The population of U.S. in the year
Answer to Problem 1GA
Solution:
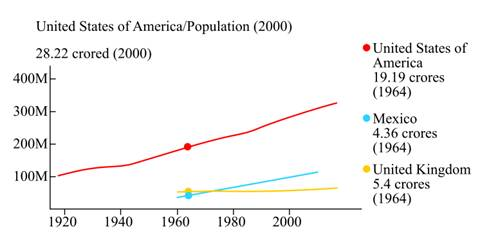
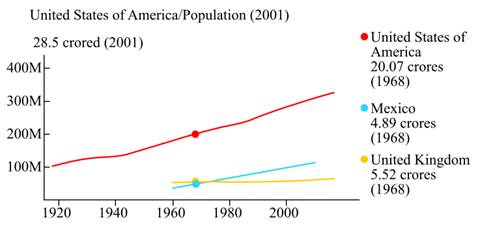
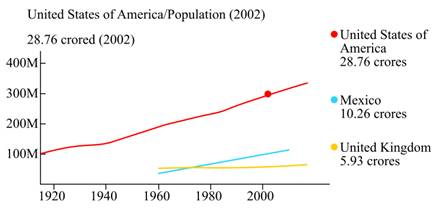
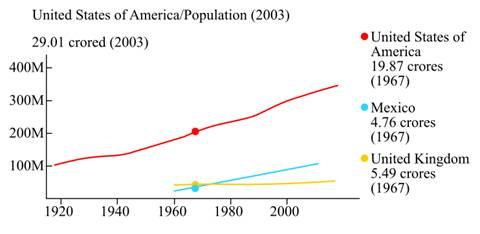
Approximately the population of U.S. in 2000, 2001, 2002 and 2003 is 28.22 crores, 28.5 crores, 28.76 crores and 29.01 crores respectively.
Explanation of Solution
Given information:
The population of U.S. in the year
Consider the population data provided by U.S. on the internet.
That is, In 2000,

In 2001,

In 2002,

In 2003,

Hence, the population in 2000, 2001, 2002 and 2003 is 28.22 crores, 28.5 crores, 28.76 crores and 29.01 crores respectively, approximately.
Want to see more full solutions like this?
Chapter 12 Solutions
Beginning and Intermediate Algebra
- Three streams - Stream A, Stream B, and Stream C - flow into a lake. The flow rates of these streams are not yet known and thus to be found. The combined water inflow from the streams is 300 m³/h. The rate of Stream A is three times the combined rates of Stream B and Stream C. The rate of Stream B is 50 m³/h less than half of the difference between the rates of Stream A and Stream C. Find the flow rates of the three streams by setting up an equation system Ax = b and solving it for x. Provide the values of A and b. Assuming that you get to an upper-triangular matrix U using an elimination matrix E such that U = E A, provide also the components of E.arrow_forwarddent Application X GA spinner is divided into five cox | + 9/26583471/4081d162951bfdf39e254aa2151384b7 A spinner is divided into five colored sections that are not of equal size: red, blue, green, yellow, and purple. The spinner is spun several times, and the results are recorded below: Spinner Results Color Frequency Red 5 Blue 11 Green 18 Yellow 5 Purple 7 Based on these results, express the probability that the next spin will land on purple as a fraction in simplest form. Answer Attempt 1 out of 2 Submit Answer 0 Feb 12 10:11 Oarrow_forward2 5x + 2–49 2 x+10x+21arrow_forward
- 5x 2x+y+ 3x + 3y 4 6arrow_forwardCalculați (a-2023×b)²⁰²⁴arrow_forwardA student completed the problem below. Identify whether the student was correct or incorrect. Explain your reasoning. (identification 1 point; explanation 1 point) 4x 3x (x+7)(x+5)(x+7)(x-3) 4x (x-3) (x+7)(x+5) (x03) 3x (x+5) (x+7) (x-3)(x+5) 4x²-12x-3x²-15x (x+7) (x+5) (x-3) 2 × - 27x (x+7)(x+5) (x-3)arrow_forward
- 2 Add the rational expressions below. Can you add them in this original form? Explain why or why not. 3x-7 5x + x² - 7x+12 4x-12 Show all steps. State your least common denominator and explain in words your process on how you determined your least common denominator. Be sure to state your claim, provide your evidence, and provide your reasoning before submitting.arrow_forwardcarol mailed a gift box to her sister the boxed gift weighed a total of 2 pounds the box alone weighed 13 ounces what was the wright of the giftarrow_forwardDirections: Use the table below to answer the following questions and show all work. Heights of Females 50.0 51.5 53.0 53.5 54.0 1. What is the average female height? 2. What are all the differences from the mean? 3. What is the variance for the female heights? 4. What is the standard deviation of the heights of the females? 5. What does the standard deviation found in number 4 represent? Write your answer in complete sentences.arrow_forward
 Algebra: Structure And Method, Book 1AlgebraISBN:9780395977224Author:Richard G. Brown, Mary P. Dolciani, Robert H. Sorgenfrey, William L. ColePublisher:McDougal Littell
 Holt Mcdougal Larson Pre-algebra: Student Edition...AlgebraISBN:9780547587776Author:HOLT MCDOUGALPublisher:HOLT MCDOUGALAlgebra & Trigonometry with Analytic GeometryAlgebraISBN:9781133382119Author:SwokowskiPublisher:Cengage
 Trigonometry (MindTap Course List)TrigonometryISBN:9781305652224Author:Charles P. McKeague, Mark D. TurnerPublisher:Cengage Learning
 Functions and Change: A Modeling Approach to Coll...AlgebraISBN:9781337111348Author:Bruce Crauder, Benny Evans, Alan NoellPublisher:Cengage Learning
 Big Ideas Math A Bridge To Success Algebra 1: Stu...AlgebraISBN:9781680331141Author:HOUGHTON MIFFLIN HARCOURTPublisher:Houghton Mifflin Harcourt


