
Concept explainers
Videos
In addition to the key words, you should also be able to define each of the following terms:
Linear relationship
Pearson
Monotonic relationship
Spearman correlation
Statistical significance of a
Regression
Third-variable problem
Directionality problem
Multiple regression
To define:
Each of the following terms: Scatter plot, linear relationships, Pearson correlation, monotonic relationship, Spearman correlation, Statistical significance of a correlation, regression, third variable problem, directionality problem, multiple regressions.
Explanation of Solution
Explanations:
Scatter Plot: It is a 2D graph between 2 variables X and Y obtained by plotting X on horizontal and Y on vertical axes. The scatter plot is mainly done to study the extent of correlation between 2 variables. If a large correlation exists then the points scatter in a line and if there's no such correlation then they are scattered randomly.
Linear Relationship: In a linear relationship the relationship between 2 variables can be represented with a line. The linear relationship can be positive or negative depending on the fact that if X increase then Y increases too and it is positive. It is negative when X increases but Y decreases. Linear relationships can be determined using scatter plots between 2 variables. There ca be no relationship too in that case the points scattered randomly. Graphical representation of positive linear relation: 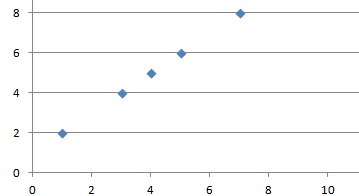
Pearson correlation:
Pearson product correlation coefficient is a measure of linear association between 2 variables X and Y. It has a value between -1 and +1 and is denoted by r.
r consists of a ratio comparing the covariance( X and Y) (numerator) with the variance of X and Y separately (in the denominator).
The formula:
Monotonic relationship: It is the degree to which the relationship is one directional. So as one value increases the other also increases and as one decreases other also decreases. Spearman correlation measures this value.
Spearman Correlation: This is distribution free alternative to Pearson r value. It measures strength and direction of monotonic relationship and used mostly for ordinal observations.
The formula is:
In this case ranks are calculated for each data X and Y and their difference is taken represented as d in the formula. It can also take values in (-1,+1)range. A high positive value like 0.9 indicates a strong positive correlation and vice versa. So here as X increases so does Y (Just like r).
Statistical Significance of a correlation: Correlation is tested using t statistic.
The formula is provided as
to test whether the linear relationship is strong enough to model the relationship in the population. The hypothesis tests decide if the population correlation
Regression: It is a set of statistical processes for establishing or estimating the relationship among variables. Regression analysis helps to understand how changes in independent variable results in changes in dependent variable. It is widely used for prediction and forecasting. It helps in understanding which independent variables are related to the dependent variable and what is the form of the relationship. In other words it can be used to establish causal relationship.
Third variable problem: In context of experimental design third variable can be confounded variable resulting in relationship between 2 variables. Example can be cities with higher churches have higher crime rate but more churches do not lead to more crime so a 3rd variable population lead to more churches and more crime.
Directionality problem: It's a problem with 2 variables when the cause and effect is not known. It's known that there exists a relationship between X and Y however whether X is due to Y or vice versa is not known. For that apart from correlational study experimental study are required to be conducted. So an example can be there's a strong correlation between amount of violence seen on Tv and amount of aggressive behavior by children but its not known whether amount of violence seen on TV is due to aggressive behavior or vice versa.
Multiple regressions: The general purpose of the multiple regressions is to establish a relationship between several predictor variables and a dependent variable. Notation ally if Y is a dependent variable and Xs are several predictors then f is a function or line of least square which is estimated in multiple regressions.
It is widely used in social and natural sciences. Educators might be interested in predictors for success in high school or psychologist might be interested in personality best predicting social adjustments.
For example Price of the house sold can be dependent variable and size of house, number of bedrooms, locality, average income in respective neighborhoods, and appeal of the house can be predictors. The other example can be Salary being dependent and amount of responsibility, number of people to supervise etc. are independent.
Want to see more full solutions like this?
Chapter 12 Solutions
Research Methods for the Behavioral Sciences (MindTap Course List)


- Examine the Variables: Carefully review and note the names of all variables in the dataset. Examples of these variables include: Mileage (mpg) Number of Cylinders (cyl) Displacement (disp) Horsepower (hp) Research: Google to understand these variables. Statistical Analysis: Select mpg variable, and perform the following statistical tests. Once you are done with these tests using mpg variable, repeat the same with hp Mean Median First Quartile (Q1) Second Quartile (Q2) Third Quartile (Q3) Fourth Quartile (Q4) 10th Percentile 70th Percentile Skewness Kurtosis Document Your Results: In RStudio: Before running each statistical test, provide a heading in the format shown at the bottom. “# Mean of mileage – Your name’s command” In Microsoft Word: Once you've completed all tests, take a screenshot of your results in RStudio and paste it into a Microsoft Word document. Make sure that snapshots are very clear. You will need multiple snapshots. Also transfer these results to the…arrow_forward2 (VaR and ES) Suppose X1 are independent. Prove that ~ Unif[-0.5, 0.5] and X2 VaRa (X1X2) < VaRa(X1) + VaRa (X2). ~ Unif[-0.5, 0.5]arrow_forward8 (Correlation and Diversification) Assume we have two stocks, A and B, show that a particular combination of the two stocks produce a risk-free portfolio when the correlation between the return of A and B is -1.arrow_forward
- 9 (Portfolio allocation) Suppose R₁ and R2 are returns of 2 assets and with expected return and variance respectively r₁ and 72 and variance-covariance σ2, 0%½ and σ12. Find −∞ ≤ w ≤ ∞ such that the portfolio wR₁ + (1 - w) R₂ has the smallest risk.arrow_forward7 (Multivariate random variable) Suppose X, €1, €2, €3 are IID N(0, 1) and Y2 Y₁ = 0.2 0.8X + €1, Y₂ = 0.3 +0.7X+ €2, Y3 = 0.2 + 0.9X + €3. = (In models like this, X is called the common factors of Y₁, Y₂, Y3.) Y = (Y1, Y2, Y3). (a) Find E(Y) and cov(Y). (b) What can you observe from cov(Y). Writearrow_forward1 (VaR and ES) Suppose X ~ f(x) with 1+x, if 0> x > −1 f(x) = 1−x if 1 x > 0 Find VaRo.05 (X) and ES0.05 (X).arrow_forward
- Joy is making Christmas gifts. She has 6 1/12 feet of yarn and will need 4 1/4 to complete our project. How much yarn will she have left over compute this solution in two different ways arrow_forwardSolve for X. Explain each step. 2^2x • 2^-4=8arrow_forwardOne hundred people were surveyed, and one question pertained to their educational background. The results of this question and their genders are given in the following table. Female (F) Male (F′) Total College degree (D) 30 20 50 No college degree (D′) 30 20 50 Total 60 40 100 If a person is selected at random from those surveyed, find the probability of each of the following events.1. The person is female or has a college degree. Answer: equation editor Equation Editor 2. The person is male or does not have a college degree. Answer: equation editor Equation Editor 3. The person is female or does not have a college degree.arrow_forward
 Glencoe Algebra 1, Student Edition, 9780079039897...AlgebraISBN:9780079039897Author:CarterPublisher:McGraw Hill
 Big Ideas Math A Bridge To Success Algebra 1: Stu...AlgebraISBN:9781680331141Author:HOUGHTON MIFFLIN HARCOURTPublisher:Houghton Mifflin Harcourt
 College AlgebraAlgebraISBN:9781305115545Author:James Stewart, Lothar Redlin, Saleem WatsonPublisher:Cengage Learning
 Algebra and Trigonometry (MindTap Course List)AlgebraISBN:9781305071742Author:James Stewart, Lothar Redlin, Saleem WatsonPublisher:Cengage Learning
 Holt Mcdougal Larson Pre-algebra: Student Edition...AlgebraISBN:9780547587776Author:HOLT MCDOUGALPublisher:HOLT MCDOUGAL
 Functions and Change: A Modeling Approach to Coll...AlgebraISBN:9781337111348Author:Bruce Crauder, Benny Evans, Alan NoellPublisher:Cengage Learning