
To determine:
The following three graphs show the level of impurities found in a particular source of drinking water.
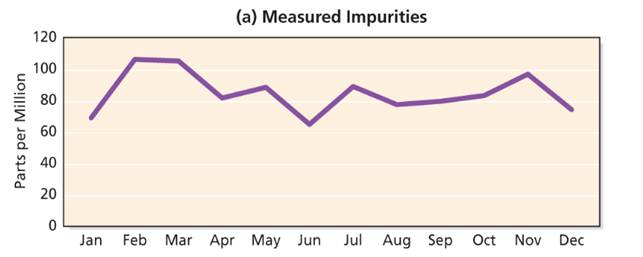
Chart (a) suggests that the source has a consistently high level of impurities throughout the year.
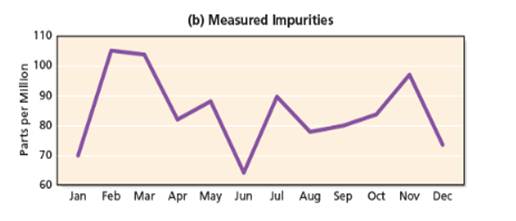
Chart (b) indicates that the level of impurities jumps up and down throughout the year.
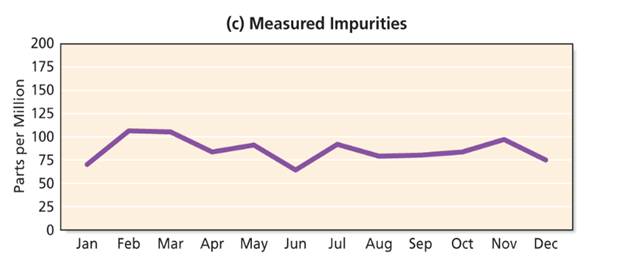
Chart (c) shows an impurity level that is fairly consistent throughout the year—and fairly low.
Introduction: Visuals such as graphs and charts included in a report/ article help to understand the text/ content easily. Those visuals have a strong impact on the readers perception about the information presented. Therefore, it is important to verify the quality of the information presented.
Answer to Problem 1CA
Solution: Visuals are a good way of presenting information. However, visuals can be created in different ways which will give the reader wrong impression. Writers should be careful not to distort information by creating visuals. If the rage is set as 0-500, the graph will show that there are no considerable variations in level of impurities.
Explanation of Solution
Although the visuals are an effective way of presenting information, they can sometimes provide wrong impression to the reader as shown in the above 3 graphs. The above graphs show the same information yet, they provide three different impressions. It is because of the vertical scales used in the graphs. In chart (a), the scale is 0-120 and it shows a fair level of variation of impurities level throughout the year. When consider chart (b), the range is set as 60-110 narrowing the scale compared to chart (a). This chart shows the reader the variation of impurities level is significant and it creates a strong impact on the readers’ impression. The chart (c) has been created by using the same data set, using a wider range 0-200. The graph shows minimum variation of the impurities level throughout year.
If the vertical scale is set to 0-500 spreading the range further compared to chart (c) above, it will further minimize the range of variation of impurities level and the reader would perceive that there is no an impact of impurities level throughout the year.
In this way, using the same data, visuals can be created to give different impressions. Therefore, writers’ task is to give the correct impression by considering the information need of the target audience.
Want to see more full solutions like this?
Chapter 12 Solutions
MYLAB EXCELLENCE IN BUSSI COMM ETEXT

- I am searching for the accurate solution to this general accounting problem with the right approach.arrow_forwardPlease provide the correct answer to this general accounting problem using valid calculations.arrow_forwardCan you solve this general accounting problem using appropriate accounting principles?arrow_forward
- Describe the difference between a strategic plan and an operational plan.arrow_forwardSarah is the president and general manager of the operation. Sarah has been very proactive in growing the business. She has met with her banker to discuss expanding the facilities and equipment with another $150,000 loan. Their first loan for $150,000 was secured by the industrial-size food production equipment purchased with the loan. The banker now demands an audit of the corporate financial statements before releasing another loan to the company. Sarah has offered to place the corporate account receivables up as collateral to secure the second loan. Based on revenue projections by her sister Jillian's sales team, Sarah believes that the company will not have trouble paying down the loan in a short period of time. Kim's assistant, Henry, monitors the production and shipment of Smackey Dog Food's regular line of products. Henry takes pride in his work and is involved in every facet of the operation. With only one other warehouse employee to help, Henry personally is involved in…arrow_forwardCompare and contrast each of the mission statements against what makes a good 'mission statement' TARGET To help all families discover the joy of everyday life. That’s our purpose. Our mission. The promise of surprises, fun, ease and inspiration at every turn, no matter when, where or how you shop. That quest to bring joy is at the center of every business decision we make. It gets our teams excited to come to work each day. And we bring it to life in so many ways. Come on in and take a look around. ALBERsons At Albertsons Companies, we are committed to running a business that makes a positive difference in our communities and planet. Our Recipe for Change is our bold vision for the future that leans into our company’s strengths and long-term strategies to drive change. CHIPOTLE Chipotle was born of the radical belief that there is a connection between how food is raised and prepared, and how it tastes. Real is better. Better for You, Better for People, Better for Our…arrow_forward
- How can managers/leaders of today encourage employee participation in the decision-making process?arrow_forwardI need assistance with this financial accounting problem using appropriate calculation techniques.arrow_forwardDodge Industries has the following data: direct labor $185,000, direct materials used $210,000, total manufacturing overhead $195,000, and beginning work in process $45,000. Compute total manufacturing costs and total cost of work in process.arrow_forward
- I am looking for the most effective method for solving this financial accounting problem.arrow_forwardTreadway Equipment acquired manufacturing machinery at the beginning of the year at a cost of $86,000. The machinery has an estimated residual value of $5,500 and an estimated useful life of 5 years. Determine the second-year depreciation using the straight-line method.arrow_forwardHow can I solve this financial accounting problem using the appropriate financial process?arrow_forward
 BUSN 11 Introduction to Business Student EditionBusinessISBN:9781337407137Author:KellyPublisher:Cengage Learning
 Essentials of Business Communication (MindTap Cou...BusinessISBN:9781337386494Author:Mary Ellen Guffey, Dana LoewyPublisher:Cengage Learning
 Accounting Information Systems (14th Edition)BusinessISBN:9780134474021Author:Marshall B. Romney, Paul J. SteinbartPublisher:PEARSON
 International Business: Competing in the Global M...BusinessISBN:9781259929441Author:Charles W. L. Hill Dr, G. Tomas M. HultPublisher:McGraw-Hill Education