
Videos
Find whether the sample data indicate that the
Perform a hypothesis test to see whether the mean number of transactions per customer is more than 10 per month.
Check whether the mean number of transactions per customer is more than 9 per month.
Find whether there is any difference in the mean checking account balances among the four branches. Also find the pair of branches where these differences occur.
Check whether there is a difference in ATM usage among the four branches.
Find whether there is a difference in ATM usage between the customers who have debit cards and who do not have debit cards.
Find whether there is a difference in ATM usage between the customers who pay interest verses those who do not pay.
Explanation of Solution
Hypothesis test for mean checking account balance:
The null and alternative hypotheses are stated below:
That is, the mean account balance is $1,600.
That is, the mean account balance is less than $1,600.
Step-by-step procedure to obtain the test statistic using Excel MegaStat is as follows:
- In EXCEL, Select Add-Ins > Mega Stat > Hypothesis Tests.
- Choose Mean Vs Hypothesized Value.
- Choose Data Input.
- Enter A1:A61 Under Input
Range . - Enter 1,600 Under Hypothesized mean.
- Check t-test.
- Choose less than in alternative.
- Click OK.
Output obtained using Excel MegaStat is as follows:
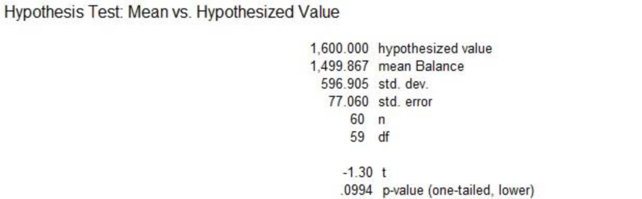
From the output, the t-test statistic value is –1.30 and the p-value is 0.0994.
Decision Rule:
If the p-value is less than the level of significance, reject the null hypothesis. Otherwise, fail to reject the null hypothesis.
Conclusion:
Consider that the level of significance is 0.05.
Here, the p-value is 0.0994. Since the p-value is greater than the level of significance, by the rejection rule, fail to reject the null hypothesis at the 0.05 significance level.
Thus, the sample data do not indicate that the mean account balance has declined from $1,600.
Hypothesis test for mean number of transaction10 per customer per month:
The null and alternative hypotheses are stated below:
The mean number of transaction per customer is less than or equal to 10 per month.
The mean number of transaction per customer is more than 10 per month.
Step-by-step procedure to obtain the test statistic using Excel MegaStat is as follows:
- In EXCEL, Select Add-Ins > Mega Stat > Hypothesis Tests.
- Choose Mean Vs Hypothesized Value.
- Choose Data Input.
- Enter A1:A61 Under Input Range.
- Enter 10 Under Hypothesized mean.
- Check t-test.
- Choose greater than in alternative.
- Click OK.
Output obtained using Excel MegaStat is as follows:
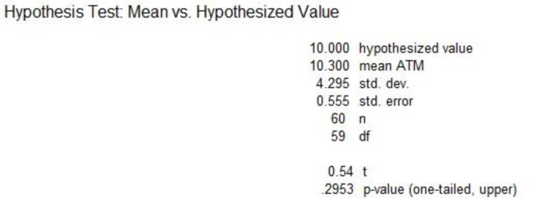
From the above output, the t-test statistic value is 0.54 and the p-value is 0.2953.
Conclusion:
Since the p-value is greater than the level of significance, by the rejection rule, fail to reject the null at the 0.05 significance level. Therefore, there is no sufficient evidence to conclude that the mean number of transactions per customer is more than 10 per month.
Hypothesis test for mean number of transaction 9 per customer per month:
The null and alternative hypotheses are stated below:
The mean number of transactions per customer is less than or equal to 9 per month.
The mean number of transaction per customer is more than 9 per month.
Follow the same procedure mentioned above to obtain the test statistic.
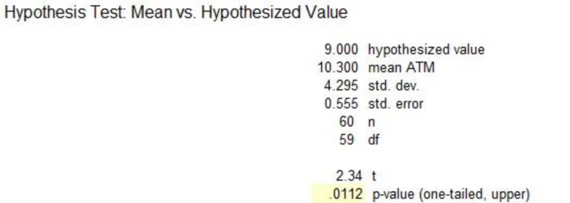
From the above output, the test statistic value is 2.34 and the p-value is 0.0112.
Conclusion:
Here, the p-value is less than the significance level 0.05. Therefore, the advertising agency can be concluded that the mean number of transactions per customer is more than 9 per month.
Hypothesis test for mean checking account balance among the four branches:
The null and alternative hypotheses are given below:
Null hypothesis:
The mean checking account balance among the four branches is equal.
Alternative hypothesis:
The mean checking account balance among the four branches is different.
Step-by-step procedure to obtain the test statistic using Excel MegaStat is as follows:
- In EXCEL, Select Add-Ins > Mega Stat > Analysis of Variance.
- Choose One-Factor ANOVA.
- In Input Range, enter the column of.
- In Post-Hoc Analysis, Choose When p < 0.05.
- Click OK.
Output obtained using Excel MegaStat is as follows:
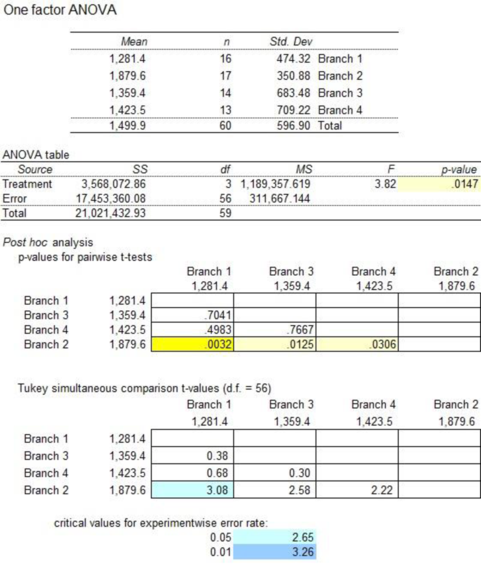
From the above output, the F-test statistic is 3.82 and the p-value is 0.0147.
Conclusion:
The p-value is less than the significance level 0.05. By the rejection rule, reject the null hypothesis at the 0.05 significance level. Therefore, there is a difference in the mean checking account balances among the four branches.
Post hoc test reveals that the differences occur between the pair of branches. The p-values for branches1–2, branches 2–3, and branches 2–4 are less than the significance level 0.05.
Thus, the branches 1–2, branches 2–3, and branches 2–4 are significantly different in the mean account balance.
Test of hypothesis for ATM usage among the branches:
The null and alternative hypotheses are stated below:
Null hypothesis: There is no difference in ATM use among the branches.
Alternative hypothesis: There is a difference in ATM use among the branches.
Step-by-step procedure to obtain the test statistic using Excel MegaStat is as follows:
- In EXCEL, Select Add-Ins > Mega Stat > Analysis of Variance.
- Choose One-Factor ANOVA.
- In Input Range, enter the column of.
- In Post-Hoc Analysis, Choose When p < 0.05.
- Click OK.
Output obtained using Excel MegaStat is as follows:
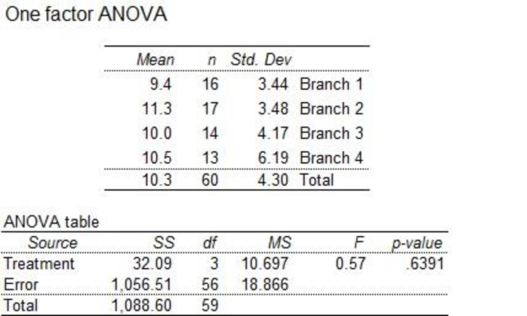
From the above output, the F-test statistic is 0.57 and the p-value is 0.6391.
Conclusion:
Here, the p-value is greater than the significance level. By the rejection rule, one is failed to reject the null at the 0.05 significance level. Therefore, it can be concluded that there is no difference in ATM use among the four branches.
Hypothesis test for the customers who have debit cards:
The null and alternative hypotheses are stated below:
Null hypothesis: There is no difference in ATM use between customers who have debit cards and who do not have.
Alternative hypothesis: There is a difference in ATM use customers who have debit cards and who do not have.
Step-by-step procedure to obtain the test statistic using Excel MegaStat is as follows:
- In EXCEL, Select Add-Ins > Mega Stat > Hypothesis Tests.
- Choose Compare Two Independent Groups.
- Choose Data Input.
- In Group 1, enter the column of without debit cards.
- In Group 2, enter the column of debit cards.
- Enter 0 Under Hypothesized difference.
- Check t-test (pooled variance).
- Choose not equal in alternative.
- Click OK.
Output obtained is represented as follows:
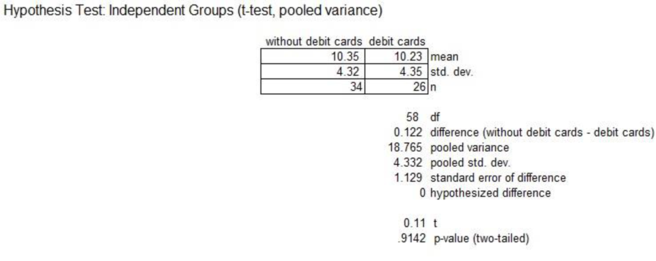
From the above output, the t-test statistic is 0.11 and the p-value is 0.9142.
Conclusion:
Here, the p-value is greater than the significance level. By the rejection rule, one is failed to reject the null at the 0.05 significance level. Therefore, there is no difference in ATM use between the customers who have debit cards and who do not have.
Hypothesis test for the customers who pay interest verses those who do not:
The null and alternative hypotheses are stated below:
Null hypothesis: There is no difference in ATM use between customers who pay interest and who do not.
Alternative hypothesis: There is a difference in ATM use customers who pay interest and who do not.
Step-by-step procedure to obtain the test statistic using Excel MegaStat is as follows:
- In EXCEL, Select Add-Ins > Mega Stat > Hypothesis Tests.
- Choose Compare Two Independent Groups.
- Choose Data Input.
- In Group 1, enter the column of Pay interest.
- In Group 2, enter the column of don’t pay interest.
- Enter 0 Under Hypothesized difference.
- Check t-test (pooled variance).
- Choose not equal in alternative.
- Click OK.
Output obtained is represented as follows:
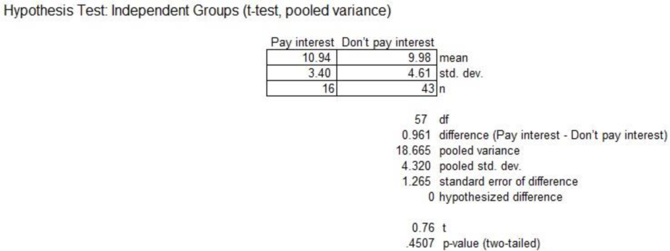
From the above output, the t-test statistic is 0.76 and the p-value is 0.4507.
Conclusion:
Here, the p-value is greater than the significance level. By the rejection rule, one is failed to reject the null at the 0.05 significance level. Therefore, there is no difference in ATM use between the customers who pay interest and who do not pay.
Want to see more full solutions like this?
Chapter 12 Solutions
Loose Leaf for Statistical Techniques in Business and Economics


- A company found that the daily sales revenue of its flagship product follows a normal distribution with a mean of $4500 and a standard deviation of $450. The company defines a "high-sales day" that is, any day with sales exceeding $4800. please provide a step by step on how to get the answers in excel Q: What percentage of days can the company expect to have "high-sales days" or sales greater than $4800? Q: What is the sales revenue threshold for the bottom 10% of days? (please note that 10% refers to the probability/area under bell curve towards the lower tail of bell curve) Provide answers in the yellow cellsarrow_forwardFind the critical value for a left-tailed test using the F distribution with a 0.025, degrees of freedom in the numerator=12, and degrees of freedom in the denominator = 50. A portion of the table of critical values of the F-distribution is provided. Click the icon to view the partial table of critical values of the F-distribution. What is the critical value? (Round to two decimal places as needed.)arrow_forwardA retail store manager claims that the average daily sales of the store are $1,500. You aim to test whether the actual average daily sales differ significantly from this claimed value. You can provide your answer by inserting a text box and the answer must include: Null hypothesis, Alternative hypothesis, Show answer (output table/summary table), and Conclusion based on the P value. Showing the calculation is a must. If calculation is missing,so please provide a step by step on the answers Numerical answers in the yellow cellsarrow_forward
 Big Ideas Math A Bridge To Success Algebra 1: Stu...AlgebraISBN:9781680331141Author:HOUGHTON MIFFLIN HARCOURTPublisher:Houghton Mifflin Harcourt
 Holt Mcdougal Larson Pre-algebra: Student Edition...AlgebraISBN:9780547587776Author:HOLT MCDOUGALPublisher:HOLT MCDOUGAL
 Glencoe Algebra 1, Student Edition, 9780079039897...AlgebraISBN:9780079039897Author:CarterPublisher:McGraw Hill